Taller Virtual de Meteorología y Clima.
Dendroclimatología o El clima a través de los árboles
- ¿Por qué estudiamos los árboles? ¿Cómo los relacionamos con el clima?
- Curiosidades
- english version
El hecho de que no tengamos medidas directas de la temperatura o precipitación del pasado es relevante, puesto que conocer estas variables nos ayudaría a entender mejor el presente. ¿Podemos saber entonces si ha habido siglos en los que la temperatura ha sido similar o mayor a la actual? A resolver esta y otras preguntas parecidas se dedica la ciencia del paleoclima. El estudio del clima pasado se puede realizar a partir de dos fuentes diferentes: las reconstrucciones a través de medidas indirectas (también llamadas proxy) y las simulaciones con modelos climáticos. En este caso nos basaremos en las primeras, que reconstruyen alguna variable meteorológica (e.g. temperatura, precipitación) a partir de medidas de otras variables no climáticas. En particular los proxy que aquí vamos a explicar son los árboles, aunque existen muchos más como los testigos de hielo, los corales, los sedimentos marinos, los diarios de navegación,... ¡de todos ellos se puede obtener información climática!

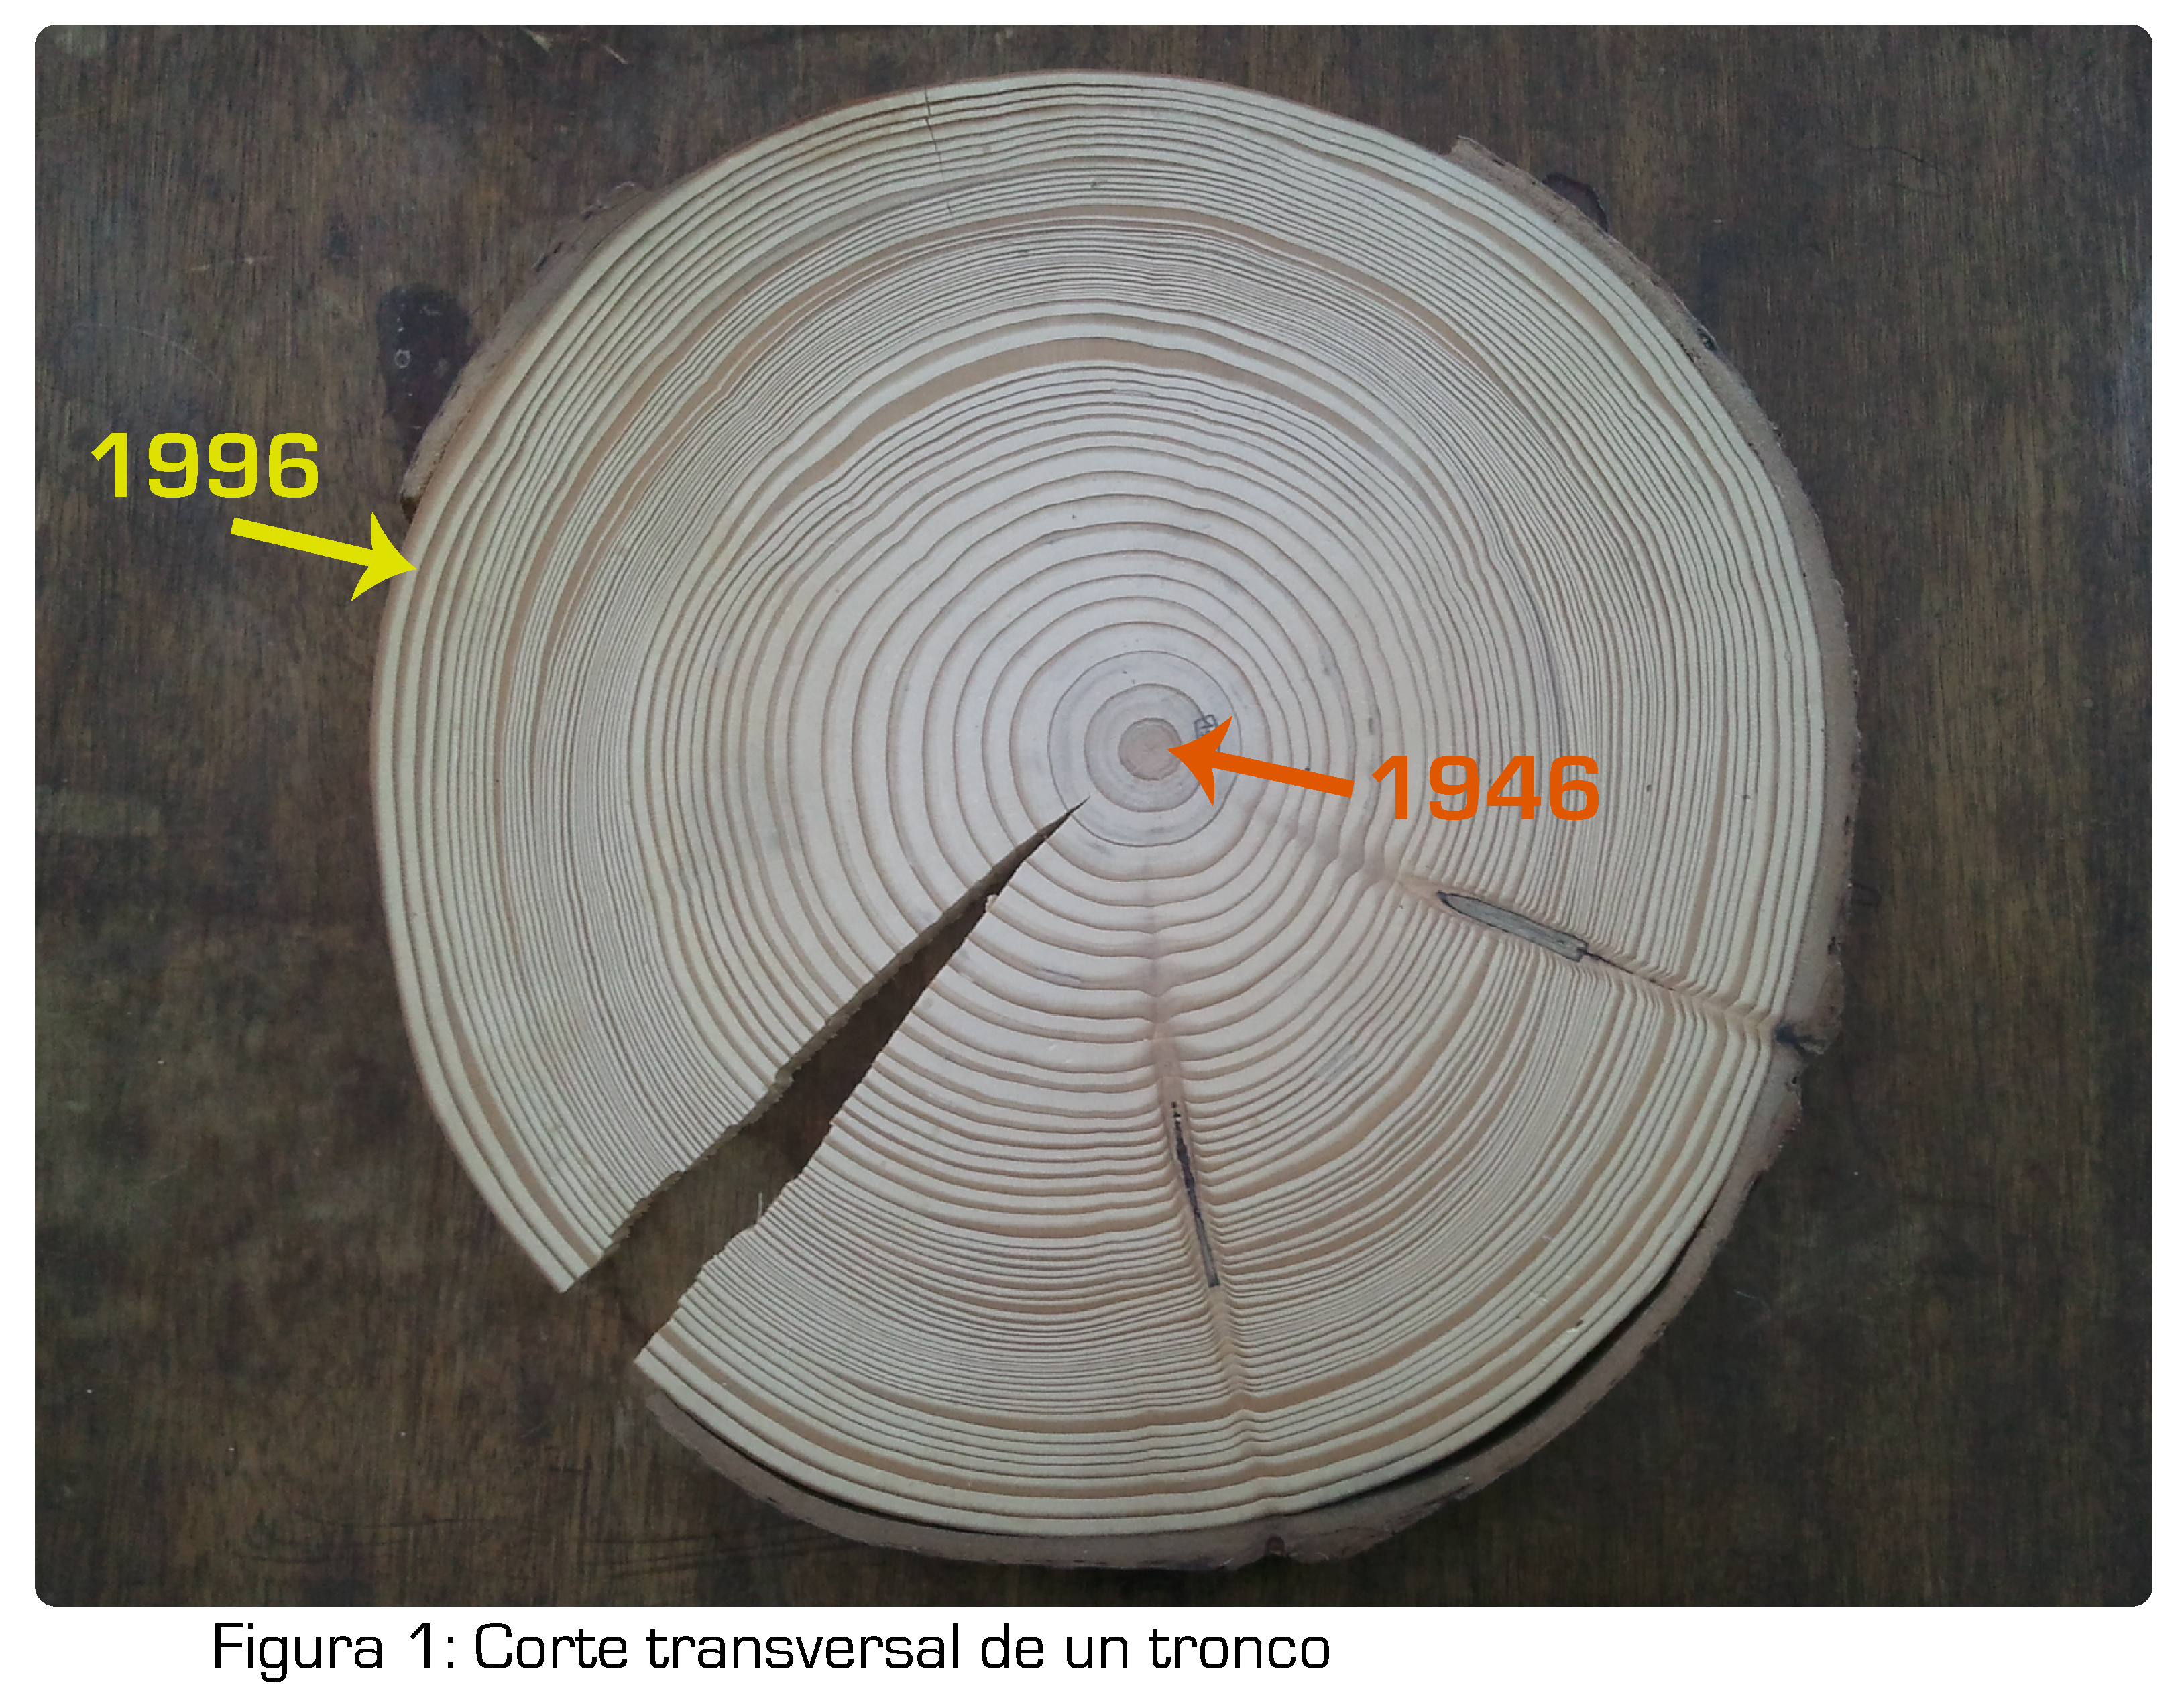
La anchura de los anillos depende de varios factores, por ejemplo, de la edad del árbol, ya que, por lo general, como pasa con el ser humano, el árbol crece más cuando es joven, y los anillos son más delgados cuando el árbol es más viejo. Pero hay algo que nos interesa más, que es el hecho de que el crecimiento de los anillos va a ser mayor cuando las condiciones climáticas sean más favorables. Lo contrario va a ocurrir cuando las condiciones sean adversas. Así, por ejemplo, si la temperatura es demasiado baja o el árbol recibe muy poca agua un año, el árbol crecerá muy poco y el anillo que se formará será más delgado de lo que le correspondería según la edad que tiene. Podemos decir que ese año el anillo es anómalamente pequeño.
Si medimos la anchura de cada anillo del árbol podemos generar una serie con valores anuales de su crecimiento. A cada año de esta serie le podemos restar lo que se esperaría que el árbol creciera ese año según su edad, es decir, que para cada año tendremos una medida de si ese árbol tuvo un crecimiento mayor o menor de lo esperado. Si esto lo hacemos para muchos árboles distintos (pero del mismo emplazamiento y la misma especie), podemos obtener una serie de valores medios de crecimiento (o mejor dicho, de anomalías de crecimiento) en esa zona. A eso se le llama cronología y es lo que intentaremos relacionar con el clima, como veremos después.
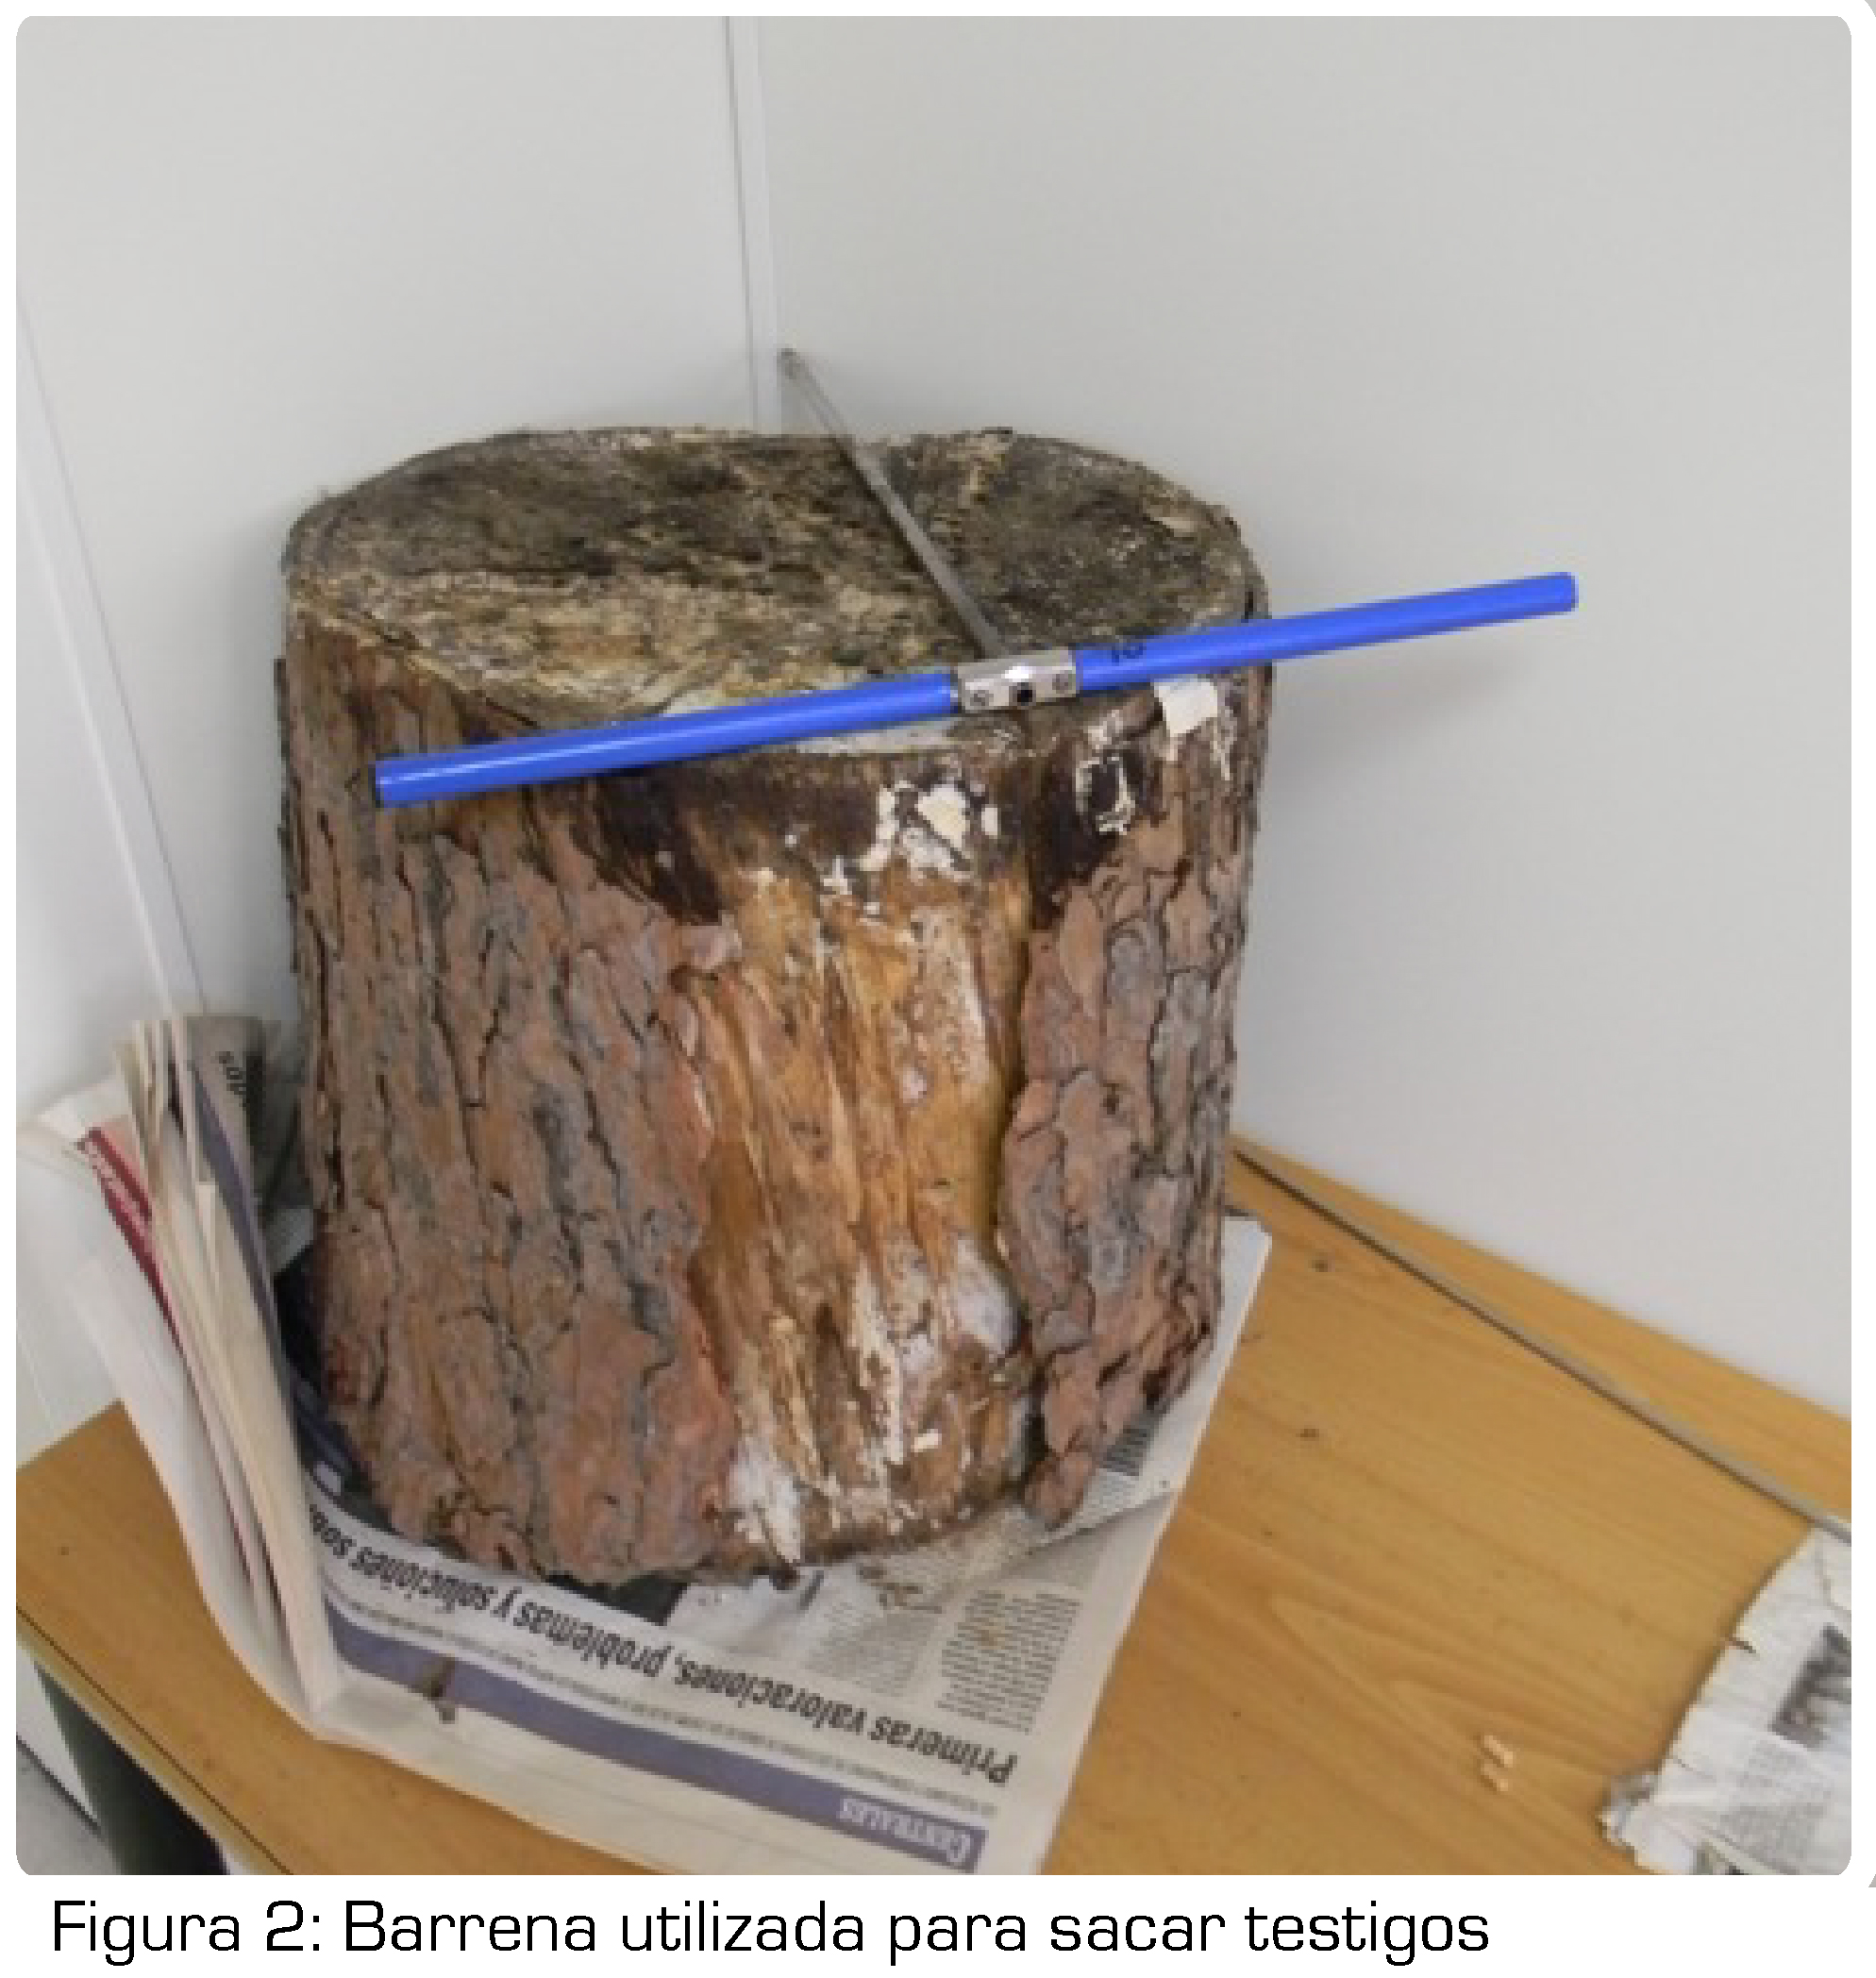
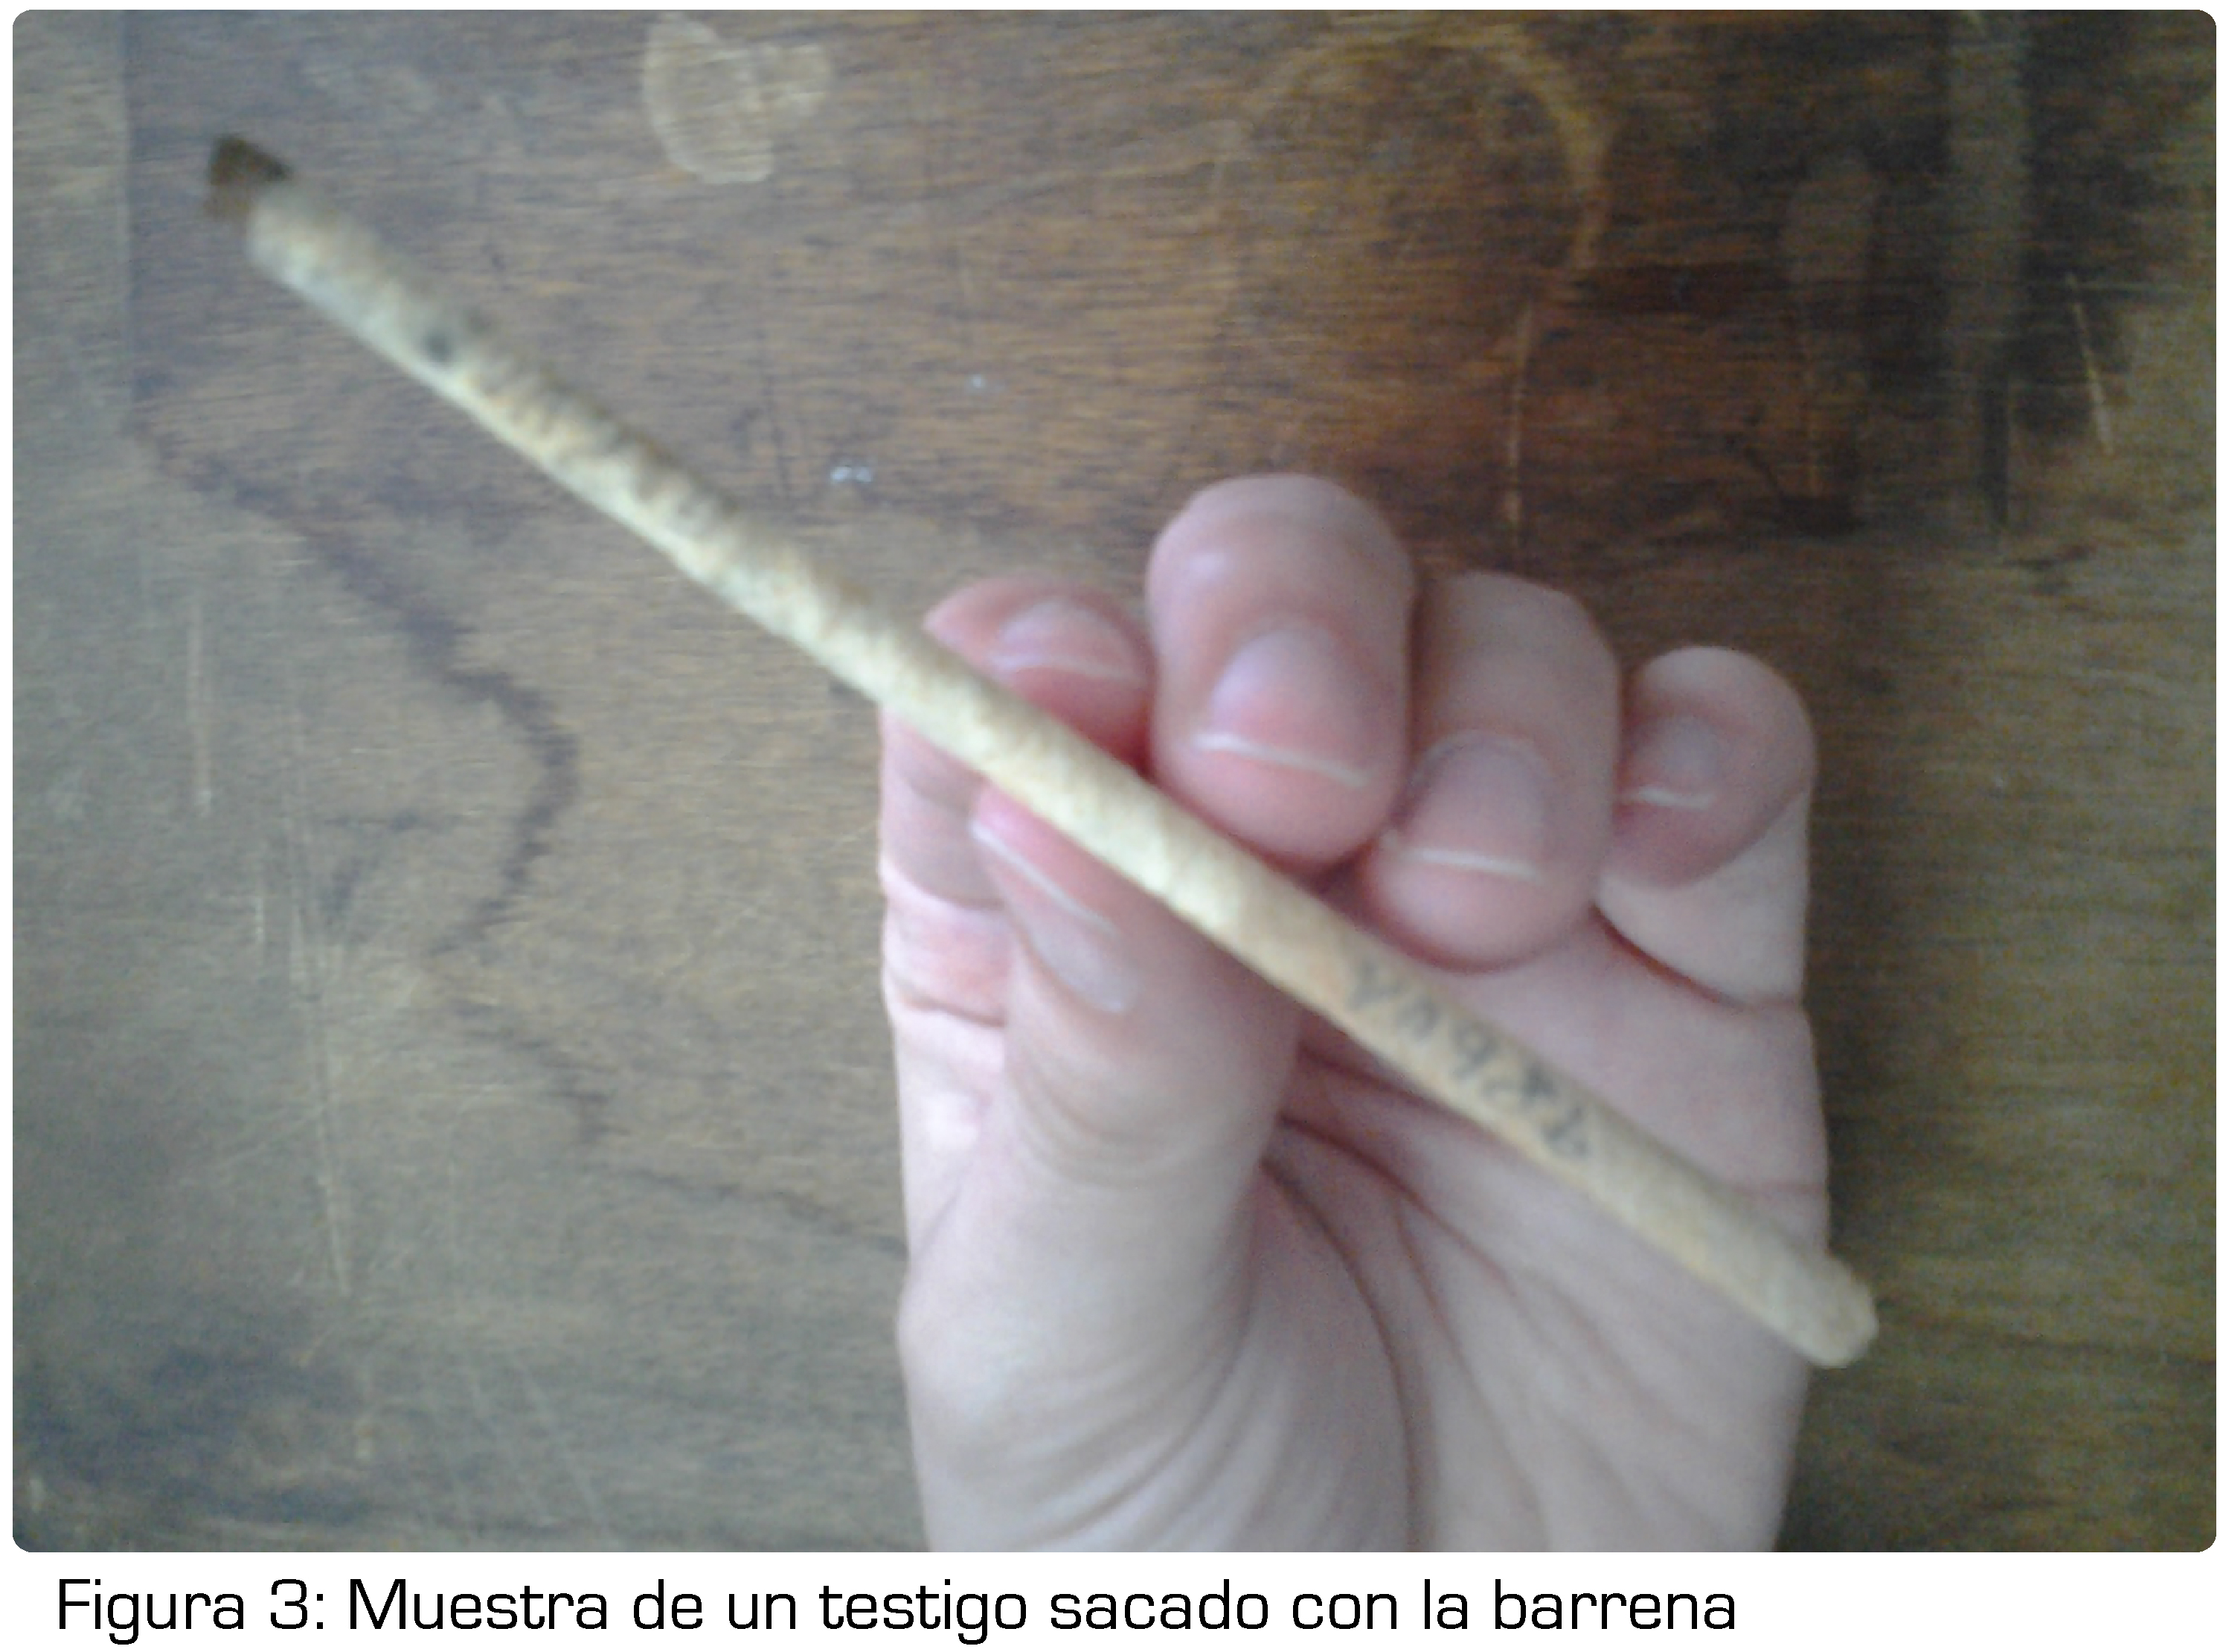
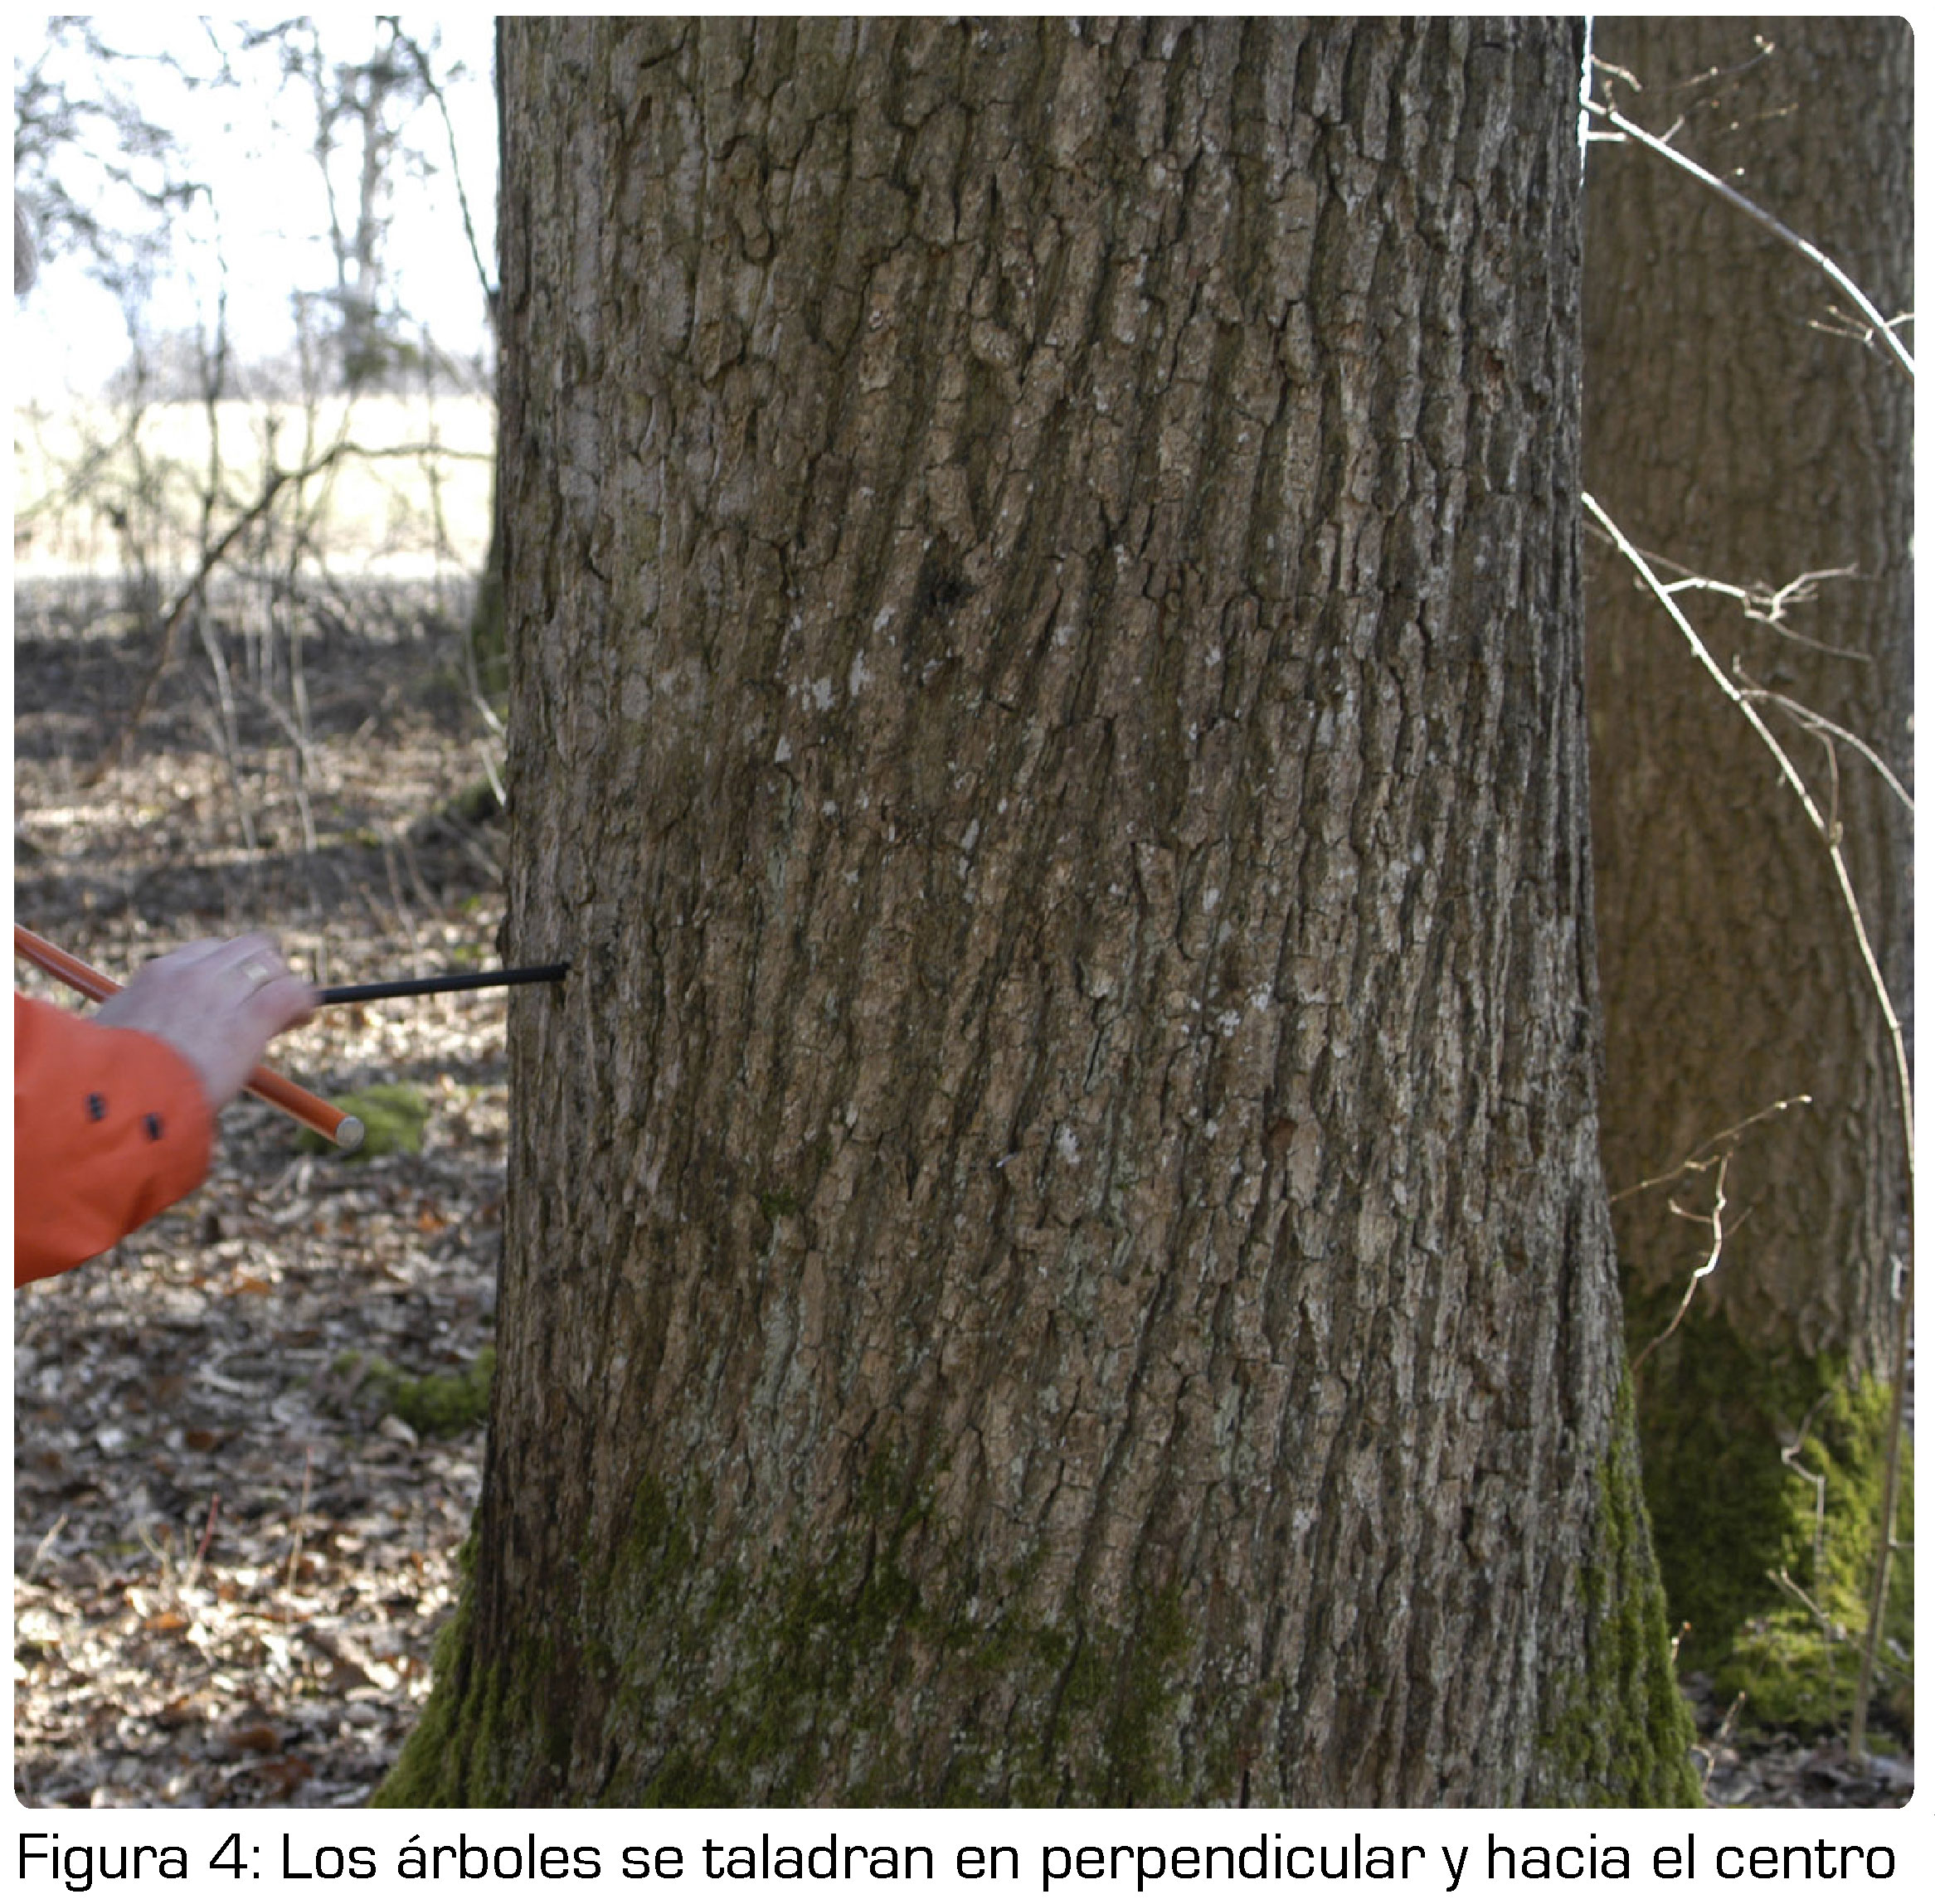
Pero, ¿cómo podemos contar los anillos sin cortar los árboles? Normalmente lo que se hace es perforar los árboles con una barrena (el instrumento de la Figura 2), que nos permite sacar un pequeño testigo de madera (Figura 3). Taladrando paralelamente al suelo y apuntando hacia el centro, el testigo extraído recogerá, con un poco de suerte, todos los anillos de crecimiento desde que el árbol nació (se puede ver un ejemplo de cómo taladrar el árbol en la Figura 4).


¿Y todos los árboles van a ser sensibles a la variabilidad del clima? Todos no. Es necesario encontrar un área en la que los árboles sufran condiciones climáticas un tanto extremas. Por ejemplo, nunca perforaremos en una ciudad, puesto que esos árboles siempre están regados, a pesar de que no llueva. Sin embargo aquellos emplazamientos considerados límite: a una altitud elevada o donde los árboles sólo reciben el agua procedente de la precipitación, serán nuestro objetivo.
Cuando tengamos nuestra serie la compararemos con los valores medidos de la variable climática que pueda ser más importante en esa zona para limitar el crecimiento de los árboles (e.g. temperatura y precipitación). Estos valores medidos, en el mejor de los casos, no suelen ir más allá del siglo XX. Si al comparar ambas series la de la anchura de los anillos guarda una buena semejanza con la de los valores observados, podremos decir que ambas series están correlacionadas (es decir, que existe una relación observable entre ambas durante ese periodo). Y ahora llega lo importante. Nuestra serie del crecimiento promedio de los anillos puede llegar a cubrir los últimos 500, 700 o incluso 1000 años (dependiendo de la edad de los árboles encontrados). Si asumimos la hipótesis de que los árboles estudiados han sido siempre sensibles a la misma variable que hemos visto antes, y que además lo han hecho siempre de la misma manera, vamos a poder utilizar nuestra serie completa de crecimiento para reconstruir los cambios pasados de la variable climática cuando no había medidas directas.
- No sólo los árboles vivos nos dan información del clima...
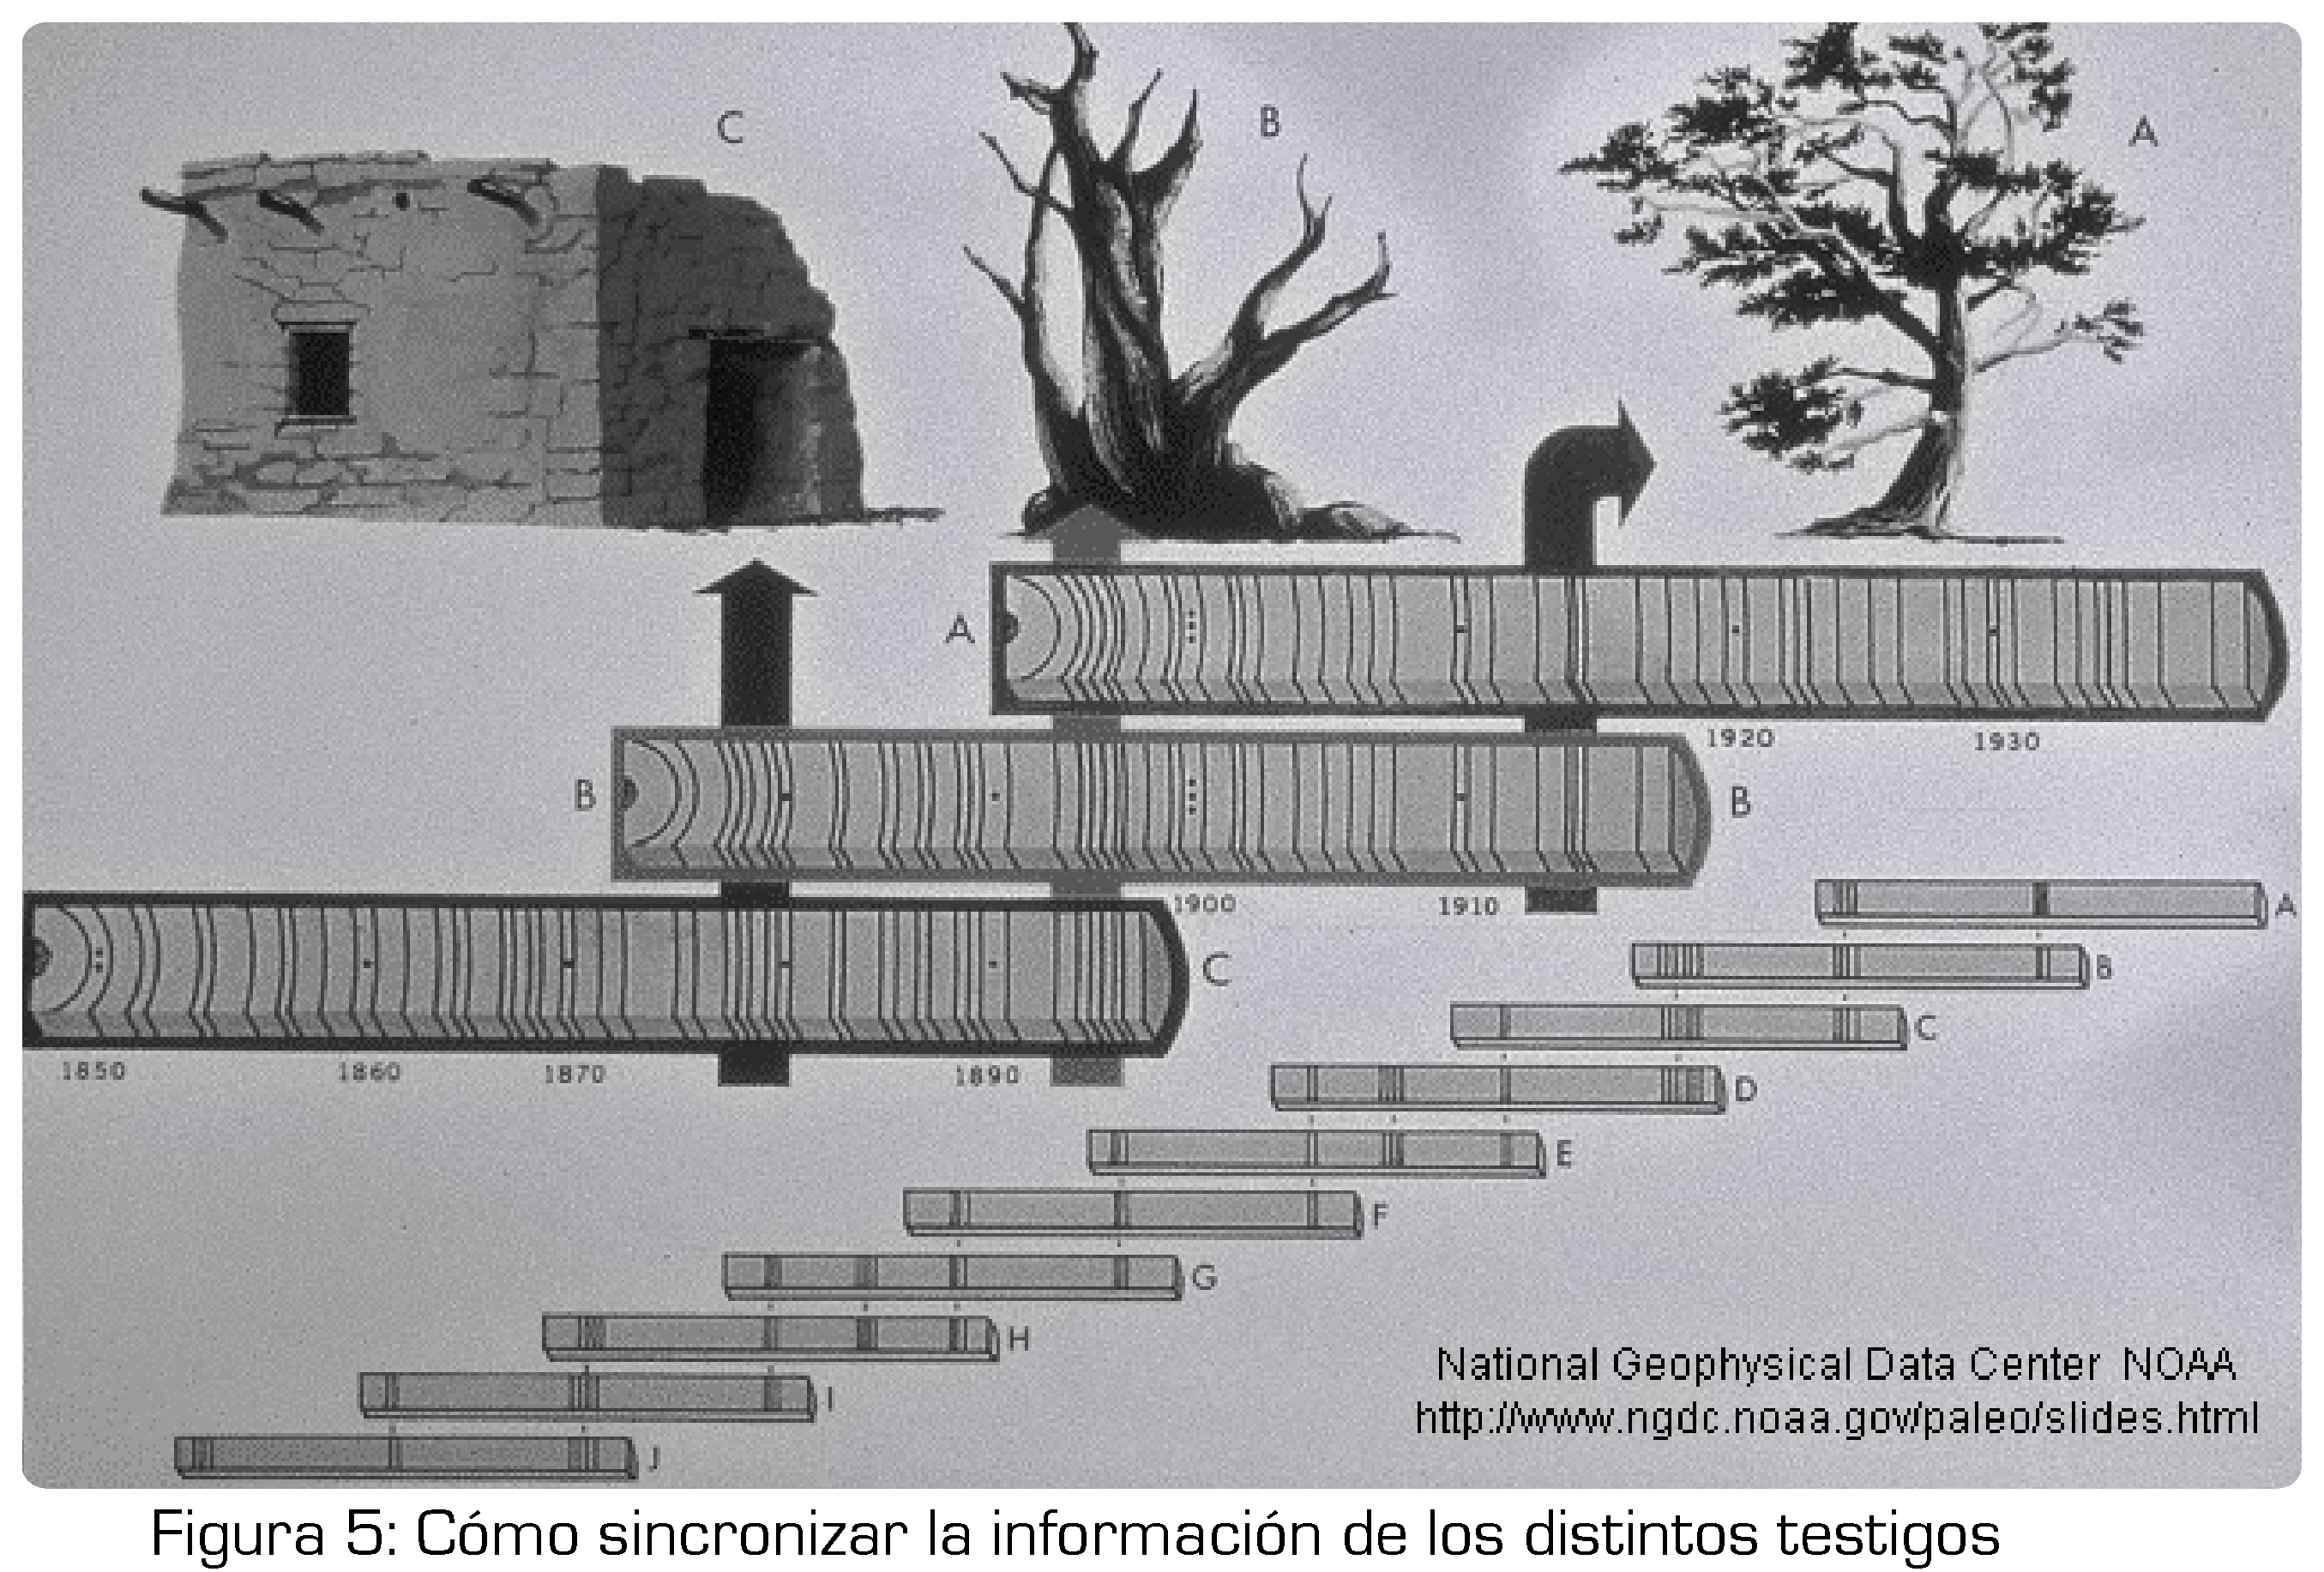
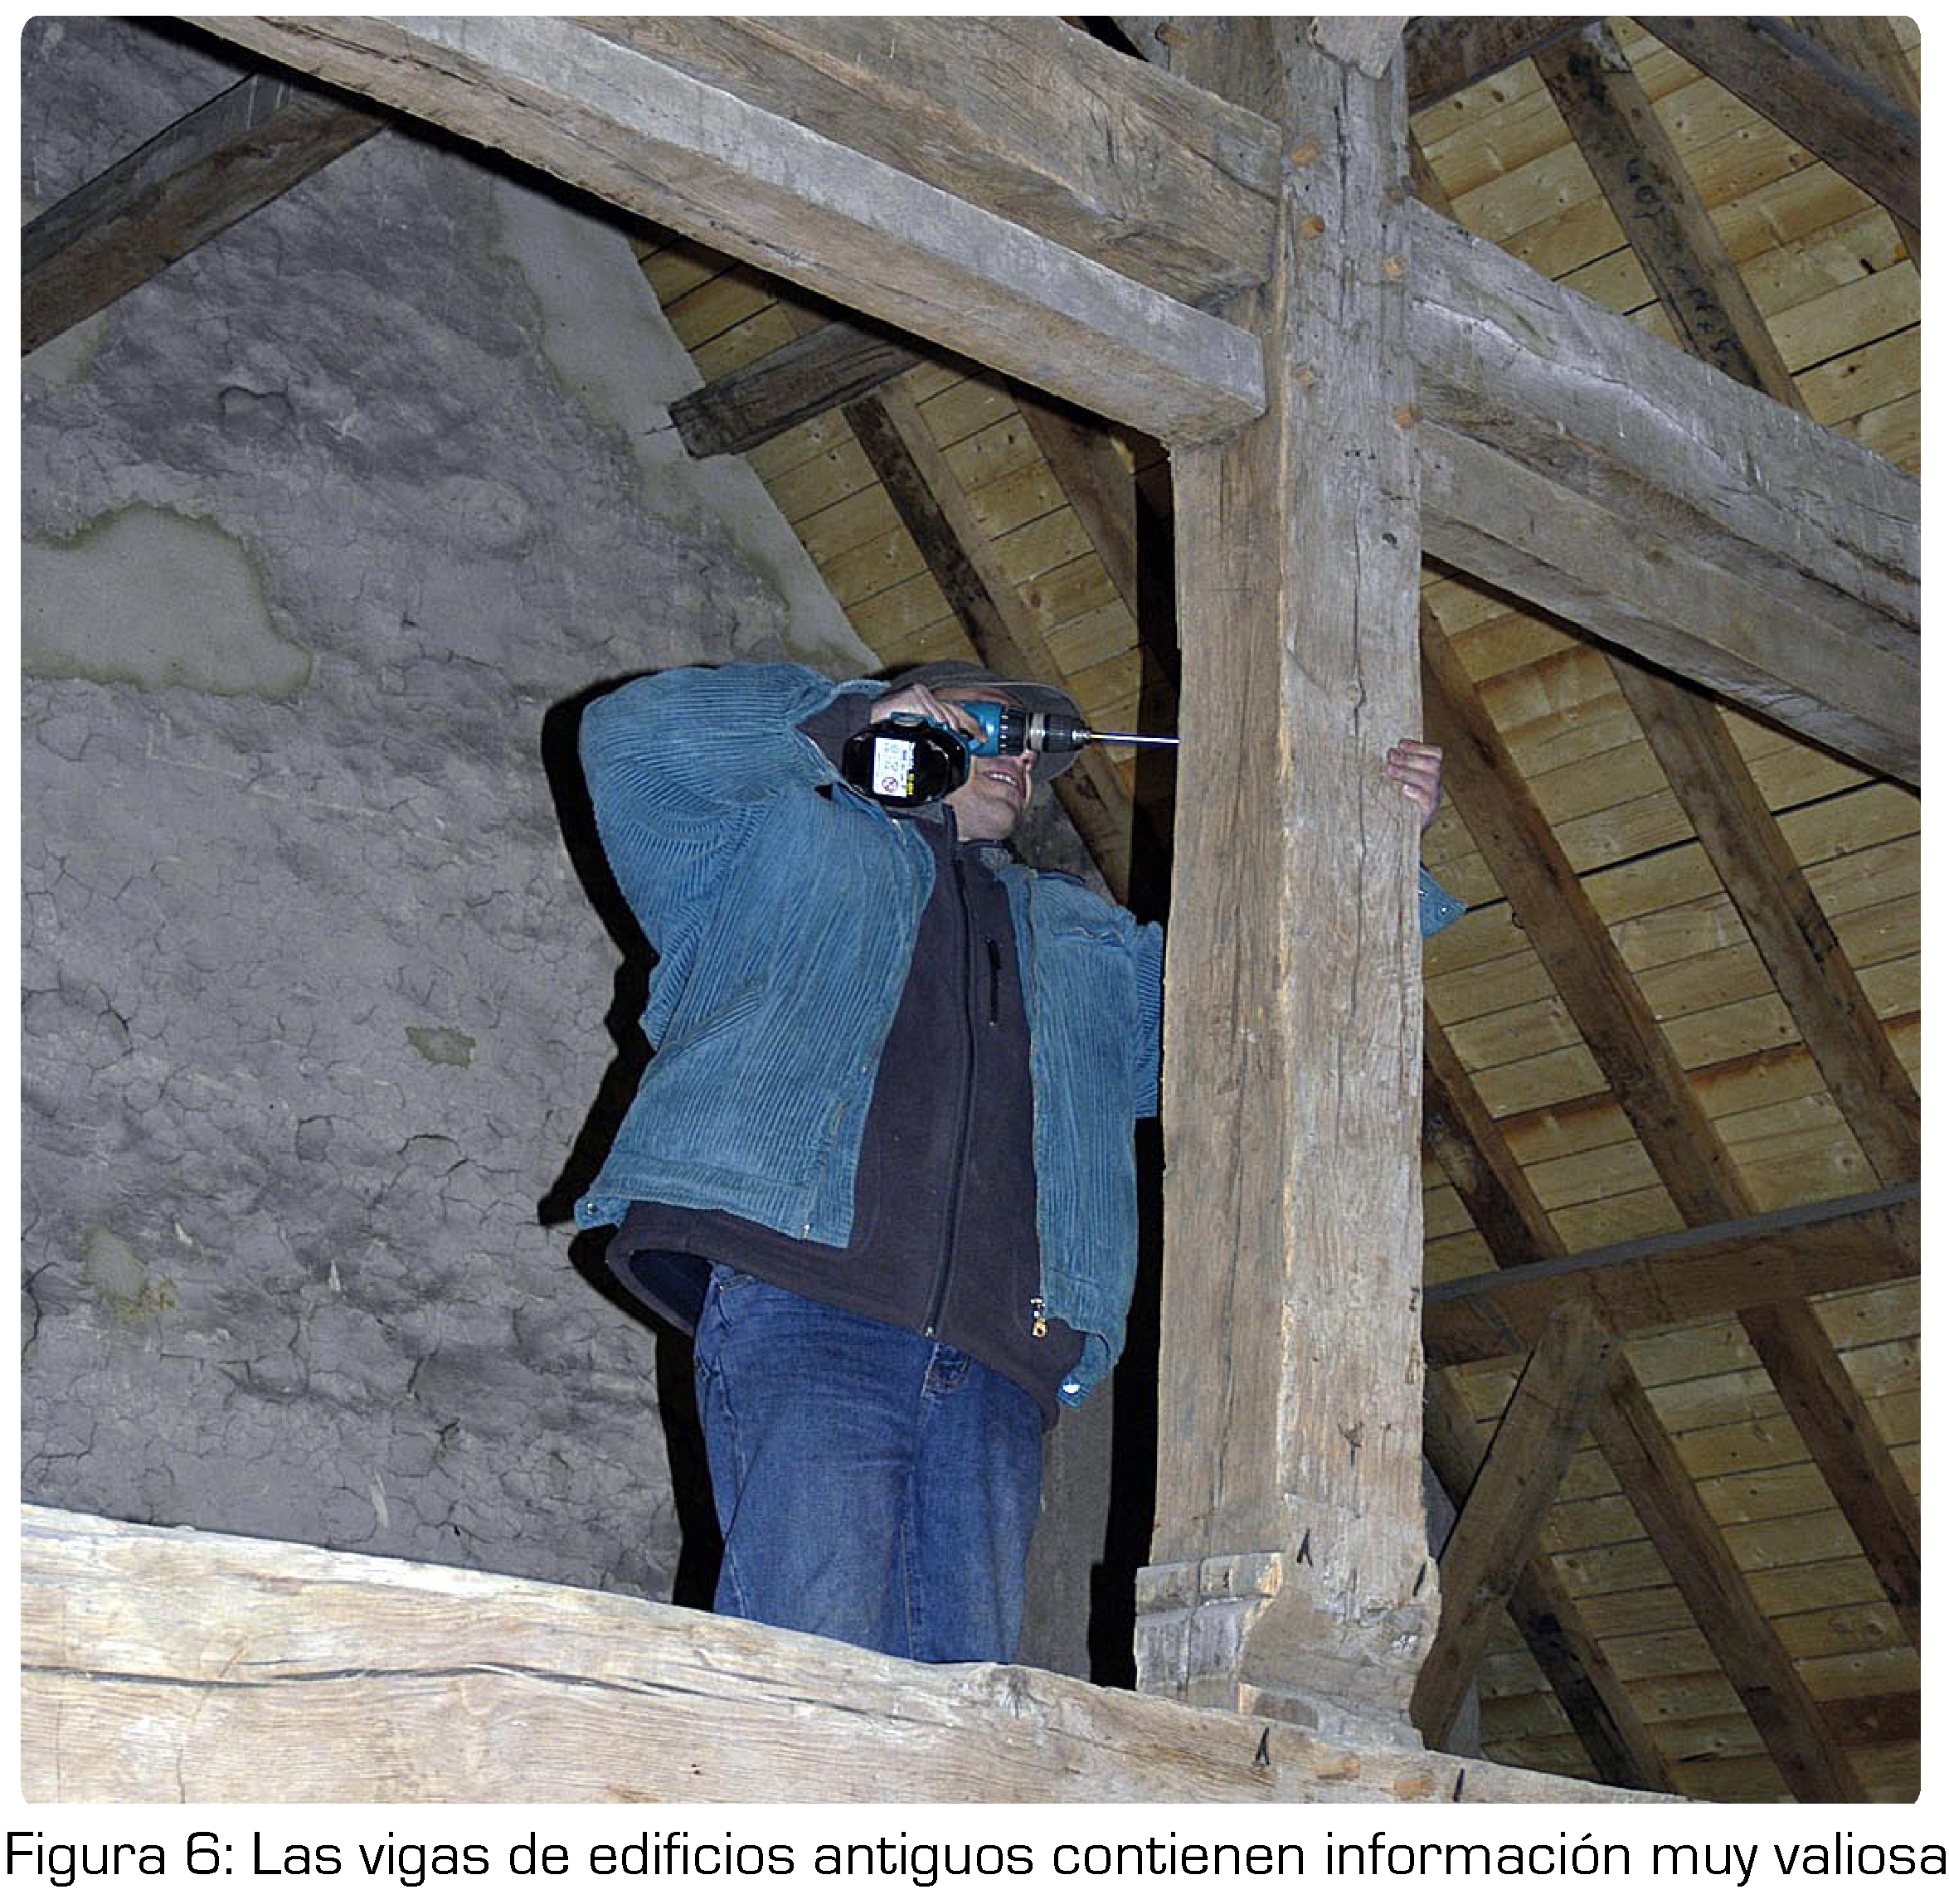
Por ejemplo, imaginemos que en una zona sólo encontramos árboles que alcanzan los 200 años, pues podríamos utilizar información de árboles muertos de esa zona (si los hubiese, claro) para intentar llegar más lejos en el tiempo. De un árbol muerto podemos extraer un testigo al igual que para los vivos, y contar sus anillos, el único problema es que no sabemos en qué año murió. Para poder asignarle una fecha concreta a los anillos de este árbol, utilizamos la serie que tenemos de los árboles vivos de la zona y buscamos un solapamiento entre las dos series (la de los vivos y la del muerto). De este modo conseguiremos poner fecha a los anillos del árbol muerto y quizá ir un poco más atrás en el tiempo, puesto que si, por ejemplo, también vivió 200 años pero murió hace 50, tendríamos información de hace 250 años. Otra forma de intentar llegar un poco más atrás es usar madera que se ha utilizado en la construcción de edificios antiguos. Podemos pensar en una iglesia que se construyera hace 200 años, por ejemplo, la madera utilizada para las vigas la podemos muestrear (figura 6), y contar sus anillos de la misma forma que en los otros casos. Podemos de nuevo buscar un solapamiento entre las series y conseguir entonces una serie de datos que alcance tiempo bastante remotos… quizá llegar a los 500 años en una zona donde los árboles que encontramos vivos no superan los 200,o ¿por qué no? ¡llegar a los 1000 años en otros lugares!


- ¿Qué se ha sabido gracias a los árboles de los últimos 1000 años?
Algo que podríamos preguntarnos es si realmente hemos avanzado en el conocimiento del clima pasado a través de los árboles. Pues bueno, la respuesta es que sí. Es cierto que se han realizado reconstrucciones climáticas a partir de otros proxies, pero los árboles han sido un elemento fundamental para conocer mejor la evolución de la temperatura del último milenio puesto que, por ejemplo, fueron la base de las primeras reconstrucciones de temperatura para este periodo. Gracias a los árboles, a otros proxies y a los modelos climáticos, ahora conocemos mucho mejor cómo fue el clima del último milenio.
¿Sabías, por ejemplo, que entre 1600 y 1800 hubo una Pequeña Edad de Hielo?
Pues sí, la temperatura media de esos siglos fue relativamente menor a la actual, como muestra por ejemplo la reconstrucción de las temperaturas de verano para Alemania de la Figura 7. Enfriamientos parecidos se produjeron en el resto de Europa. Por ejemplo, en Inglaterra, las temperaturas eran tan bajas que las aguas del río Támesis se helaban frecuentemente (esto no ocurre hoy en día ni en el día más frio de invierno), así que la gente aprovechaba para patinar sobre él, como se puede observar en algunos cuadros de aquella época.

Los árboles también nos cuentan que antes, durante la Edad Media, el clima fue probablemente más cálido que durante la pequeña edad de hielo. No está claro todavía, sin embargo, si la temperatura actual es superior a la del periodo cálido medieval.
Dedroclimatology or Climate in the memories of trees
Why studying trees? How can they be related to climate?
Nowadays it is very easy to find out about the temperatures experienced almost anywhere in the world just yesterday, or whether it rained or not two days ago; even how much it did. It is as easy as browsing a little bit in internet.
We can even know the local weather any given day ten years ago. This is because we have well organized instrumental data: meteorological variables are observed in a systematic and regular way, each day at the same time, following internationally coordinated protocols. However, this has not always been the case and 200 years ago, for instance, temperatura and precipitation were recorded at very few places each day. An international global scale observational network was far from existing yet.
Knowing past temperature and precipitation changes is relevant to better understand climate variability. Therefore, the lack of availability of direct instrumental observations in the past is a relevant issue. Is it posible to know in any other way if there have been times when temperatures have been similar, higher or lower than today? Paleoclimate science addresses such type of questions.
The study of past climate can be done through two different avenues: the development of climate reconstructions that use indirect observations (also called proxy) of past climate and the numerical simulations performed with climate models. Here we will focus on the former, that target the reconstruction of some climate parameter (e.g. temperature, precipitation) from proxy measurements of non climate variables. The proxy data we will deal with here are specifically those related with tree growth, although there exist other kinds of proxy information in trees like density or the concentrations of certain isotopes. Additionally one can also obtain proxy information from other biogeopysical systems like ice cores, corals, marine sediments, documentary data like ship logbooks or farmer diaries… all of them provide very interesting and useful climate related information!
Trees grow, as shown in Figure 1, widening their trunk building up a ring each year. This allows knowing very easily how old they are. The ring close to the crust is the last one and in the center the first year of life of the tree is recorded. The first year of growth of the tree in Figure 1 was 1946 and the last year was 1996: a life span of 50 years. Thus, knowing the year in which the tree sample was taken, we can count backwards through the yearly rings and asign each of them a year in the calendar.
Ring width depends on several factors. One of them is the age of the tree as trees, like human beings, grow more when they are Young and build comparatively thinner rings when they grow older. A more interesting issue is that rings are wider when environmental conditions are favourable for the growth of the tree and the contrary happens when adverse conditions take place. For example if temperatures are too low or trees are exposed to water stress in a given year, growth will be lower and the width of the ring will be lower than what would be expected from the age of the tree. We can say that ring would be anomalously small.
If we would record the width of each ring in the tree we can generate a series with yearly values representing its growth. We can substract from each value the expected growth according to the age of the tree, thus having an estimate that will tell us if each year the growth was anomalously above or below the expected value. If we do this for a number of trees of the same species within an área and calculate the averages we can obtain a time series of yearly mean growth for the área; or better said: of mean growth anomalies. The analysis should be done separately for different species as the growth response varies for different kinds of trees. The resulting series is called a chronology and this is what is related to climate, as discussed bellow.
But, how can we count rings without cuting down the trees? This is done by extracting a core, with a drill (see the instrument in Figure 2). This allows us extracting a little wood sample (Figure 3). The drilling is done parallel to the floor and in the direction of the tree center. With a bit of luck and savoir fair the core will include all the rings built through the life of the tree; Figure 4 shows this process.
Will all trees be sensitive to climate variability? In fact, not all of them will show climate variability in an intense enough fashion. It is necessary to fin dan área where trees are exposed to somewhat stressful climate conditions. You will not find these type of trees in a town where they are regularly watered and relatively well taken care of even if environmental conditions are harsh for them. However, those sites closer to limit conditions for tree survival are more interesting: elevated heights or in áreas where drought extreme conditions gobern the growth of trees. These places constitute the targets.
The chronology is then compared with instrumental values of the climate parameter of interest that may be relevant in the área to control the growth of trees (e.g. temperature, precipitation, drought). In the best case scenario these observational values will not span much longer than the 20th century. If the chronology and the series of the climate parameter are correlated with each other there is potential for climate reconstruction. This is the important bit: the series of growth anomalies can really span much longer than the instrumental series, often the last few centuries and it is not extrange that sometimes the last 500 or 700 years; in some cases even the whole last millennium and longer, depending on the age of the oldest trees in the site. If we assume that the link between tree growth and the climate parameter has kept being stable through all those centuries in the same manner, then an statistical relationship can be derived to estimate local temperatura or local precipitation as a function of tree-growth. This relationship can be used to obtain estimations of local climate variables all the way back to the beginning of the chronology long before thermometers and other meteorological instruments were invented.
Curiosities..
Not only living trees provide climate information...
Because, how far back in time can we go with trees? This will depend on the age of the trees we drill. However, in addition to living trees we can also sample other kinds of evidences thereby extending our time series further into the past. This is represented in Figure 5.
For instance, let us imagine that within an specific área the oldest trees are 200 years old. If there would be remains of non living trees at the site, such information could potentially be also included to extend our time series.
Cores can be extracted from non living material in the same fashion as from living trees; the only problema being that we do not know when that tree lived or when it died. In order to asign specific dates to the rings in a tree sample from dead material, we use the series obtained from living trees at the site or at a nearby site and we search for an interval of analog behaviour in both time series, the dead and the living tree chronologies. In this way we can asign calendar dates to the chronology obtained from the dead material and perhaps extend our original chronology back in time. Just consider that if the tree would have lived also 200 years but died 50 years ago, we would have information foro ver 250 years.
One approach do develop this strategy is to use would that has been used in the construction of old buildings, timber wood. We can think of a church built 200 years ago for instance. We can sample the wood used for the columns and beams (Figure 6) and count the rings in the same fashion as described above. We can search for patterns of analog behavior in tree growth and overlap bits of time series from different samples going further and further back in time; maybe reaching as far back as 500 years or more in an área where the oldest living trees are about 200 years, or, why not? Maybe expanding our adventure to the whole millennium at some sites.
What have we learned of the last 1000 years from the trees?
We can ask ourselves if we have really improved our knowledge of past climate from the trees. The answer is that we defenitively have. Many reconstructions have been developed from proxy data, and dendrochronology has been a fundamental player to better understand last millennium temperatures. Dendro proxies were actually the basis for the first temperature reconstructions for this period. Thanks to the trees, to other proxy information sources and to climate models we know now much better the evolution of last millennium climate.
Did you know for instance that between 1600 and 1800 CE a Little Ice Age was experienced?
It was, the mean temperatura of those centuries was relatively lower than todas as shown in the summer temperatura reconstruction for Germany in Figure 7. Similar cold temperatures were experienced in the rest of Europe. For instance, in England the temperatures were so low that the Thames was often frozen, which does not happen nowadays, note ven in cold winters. So people could enjoy and practice ice skating over it as some paintings made at the time show.
Trees also reveal that during middle ages climate was warmer in many places of the Northern Hemisphere than during the Little Ice Age. It is not totally clear if present temperatures are above those of the so called Medieval Climate Anomaly, they likely were.
Imágenes