Taller Virtual de Meteorología y Clima.
¿Con el agua al cuello?
- Fundamento
- Curiosidades
- Experimentos
- english version
Temperatura global y nivel del mar actualmente
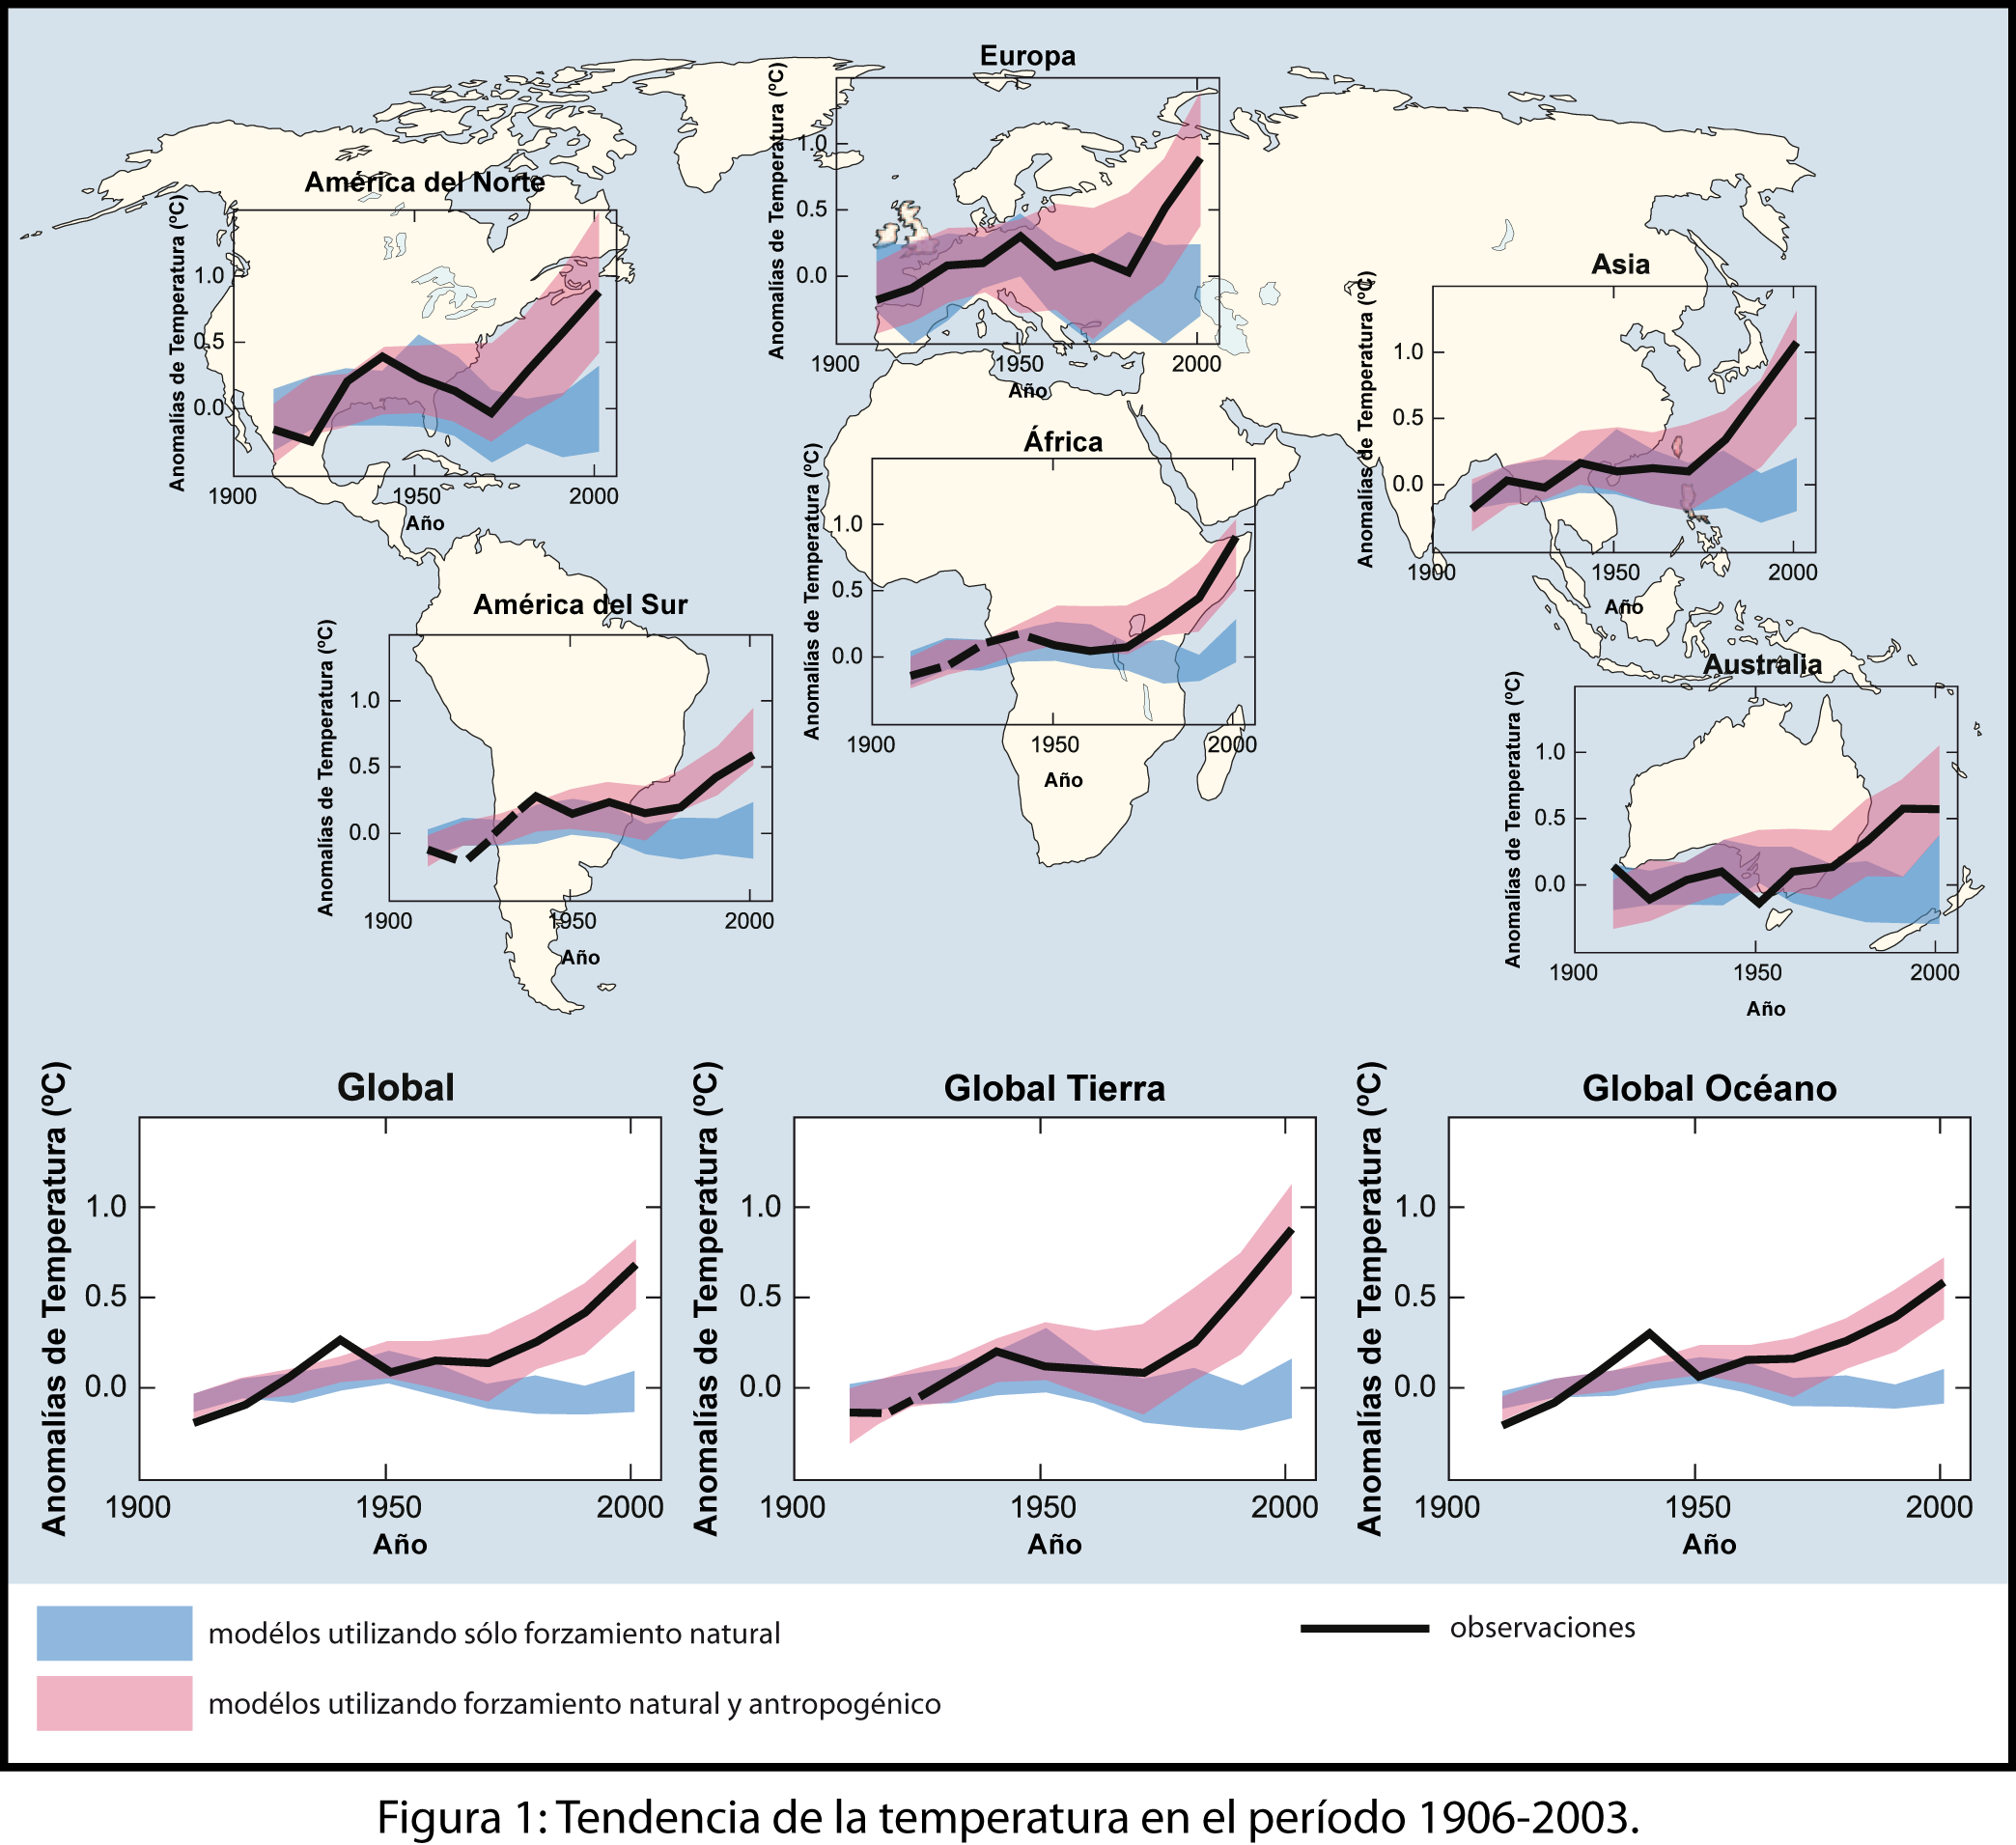
Como recoge el informe del IPCC (Intergovernmental Panel on Climate Change), la tendencia creciente de temperatura global del ultimo siglo no se puede explicar sin atribuirlo a factor humano (hay variabilidad natural pero ésta no es suficiente para explicar por sí sola la subida). Se estima que en los últimos 100 años (1906-2005) ha habido un aumento de temperatura de unos 0.7ºC en total a nivel global (aunque repartido de manera desigual): mayor en latitudes boreales -esto es, las más cercanas a los polos- y diferente según los continentes, como se ilustra en las figura 1. Esto ha dado lugar a una subida del nivel del mar a un ritmo de unos 1.8mm/año en el periodo 1961-2003 y de unos 3.1mm/año entre 1993-2003.

Estimaciones para finales del siglo XXI.
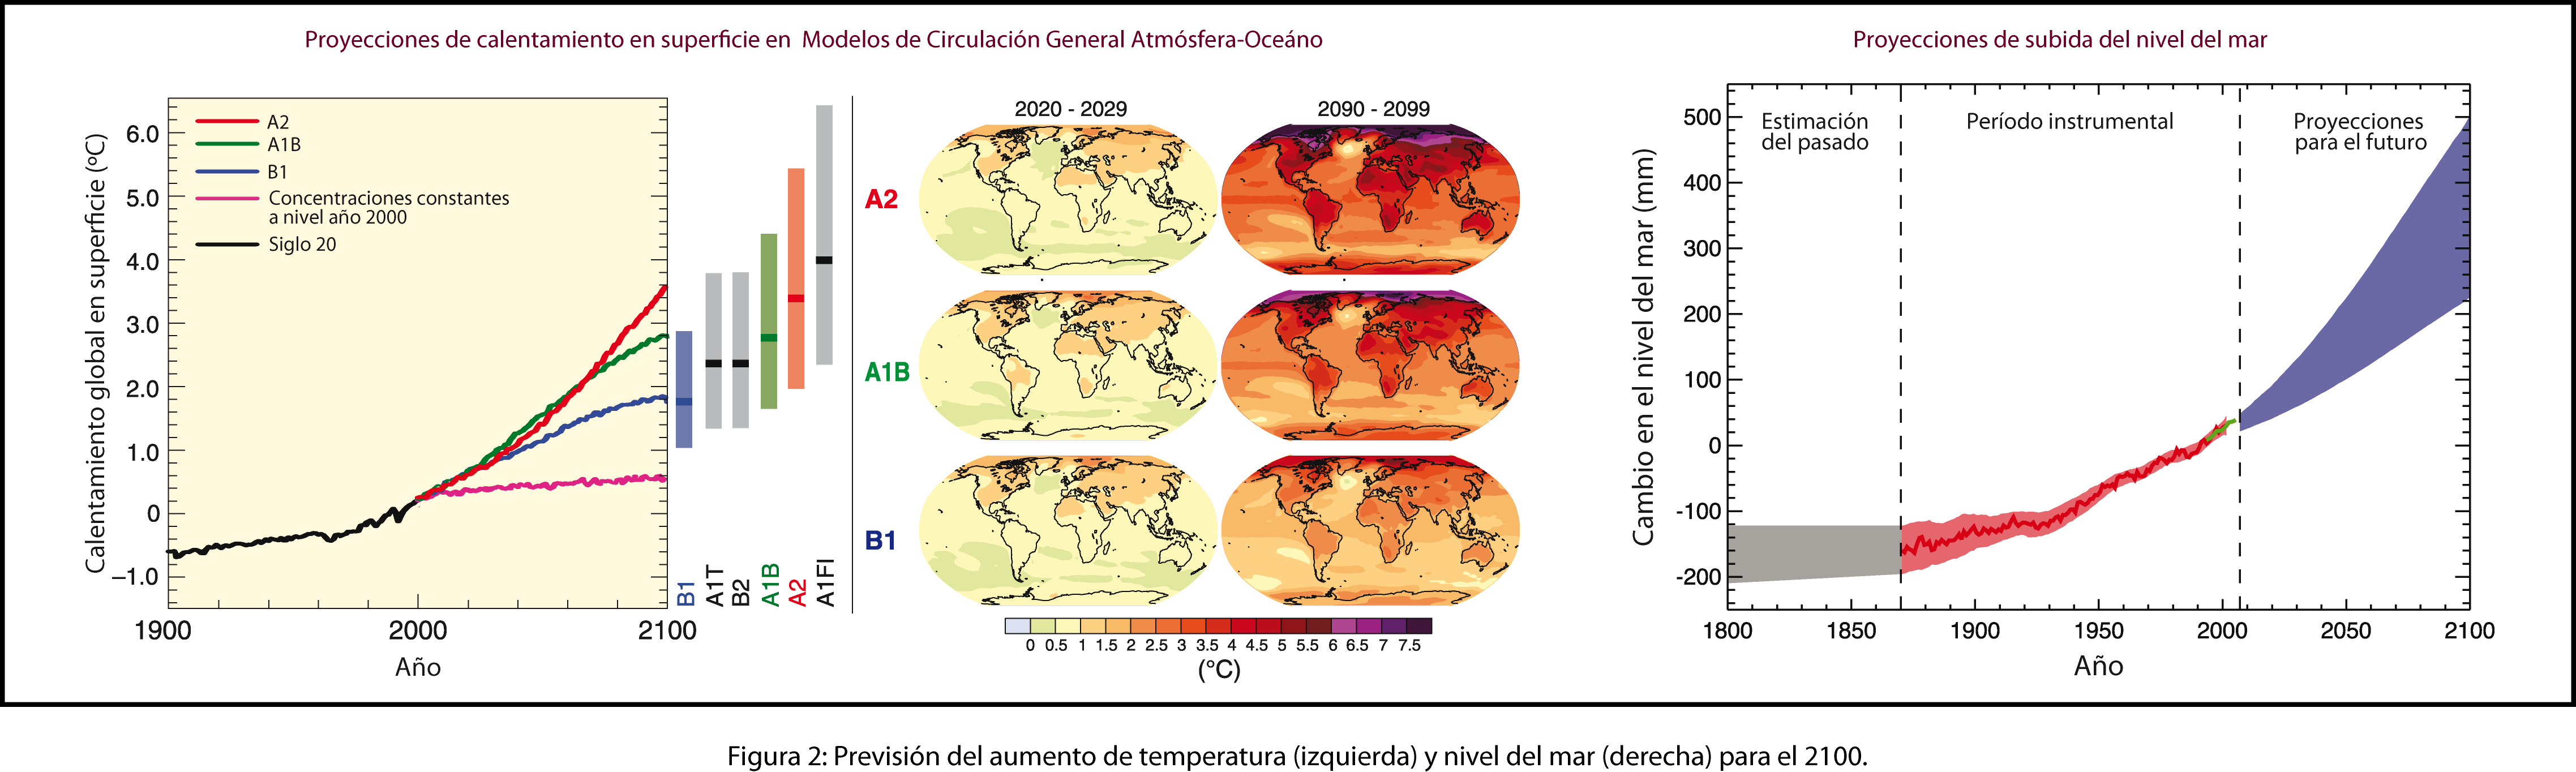
Los modelos climáticos estiman una subida de entre 0.6ºC (escenario con emisiones de gases invernadero al nivel del año 2000, el mejor de los casos) a 4.0 ºC (el peor de los casos) (como se ve en la figura 2), lo que daría lugar a un aumento en el nivel del mar de entre 110-559 mm. ¿Pero qué mecanismos contribuyen a la subida del nivel del mar?

El hielo que se derrite...
Por una parte tenemos el efecto del derretimiento del hielo por causa del aumento de temperatura… ¿Pero contribuyen de la misma manera los deshielos de cualquier parte del mundo?
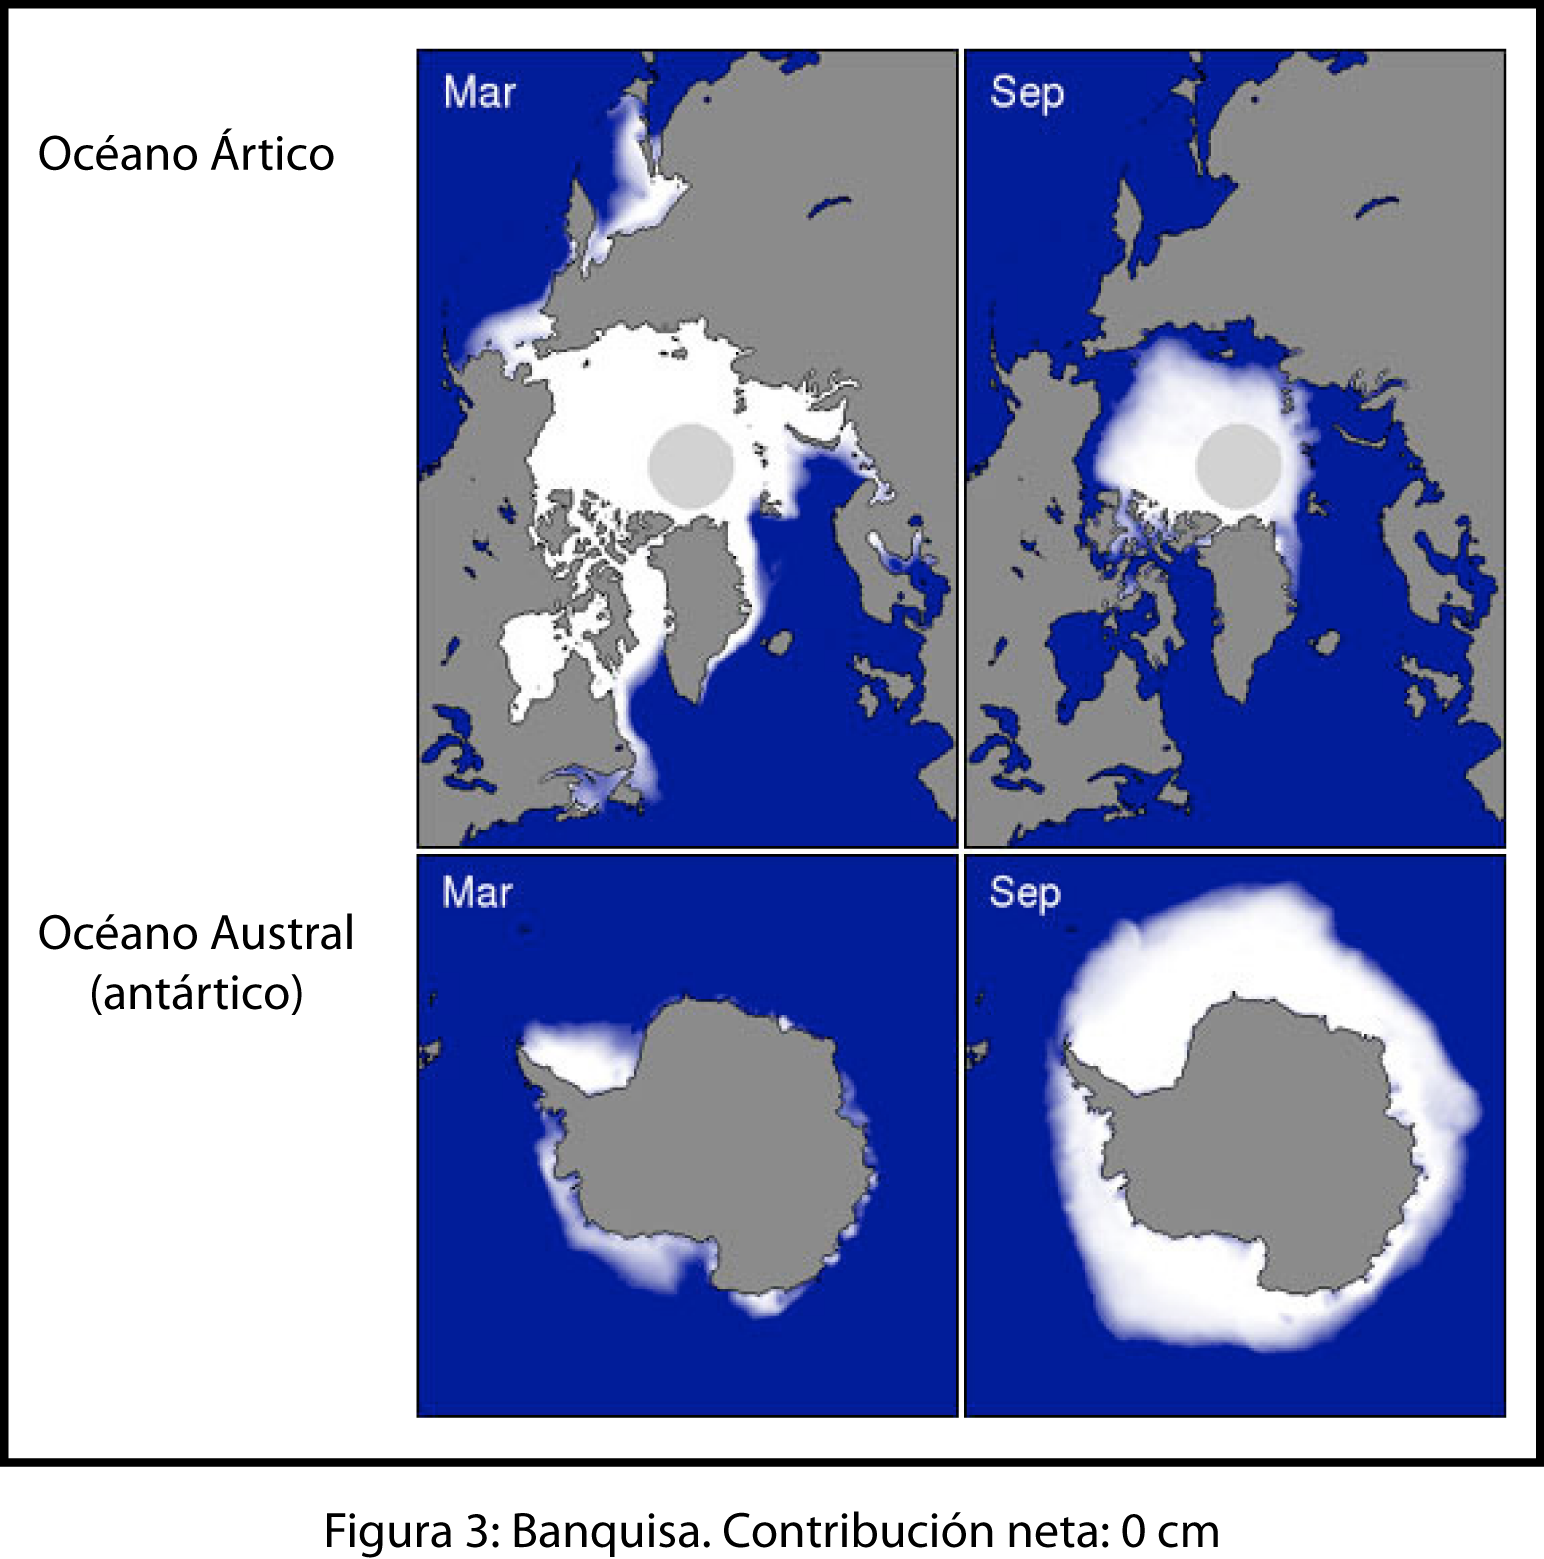
- La banquisa: la banquisa es hielo flotante de origen marino, es decir,aquella masa de agua oceánica que se congela durante los inviernos, se mueve por el efecto de las corrientes oceánicas y atmosféricas y parte de ella se derrite en verano. Al provenir directamente de agua del mar, su derretimiento no afectaría a la subida del nivel de ésta. La ubicación de la banquisa la podéis ver en la figura 3.

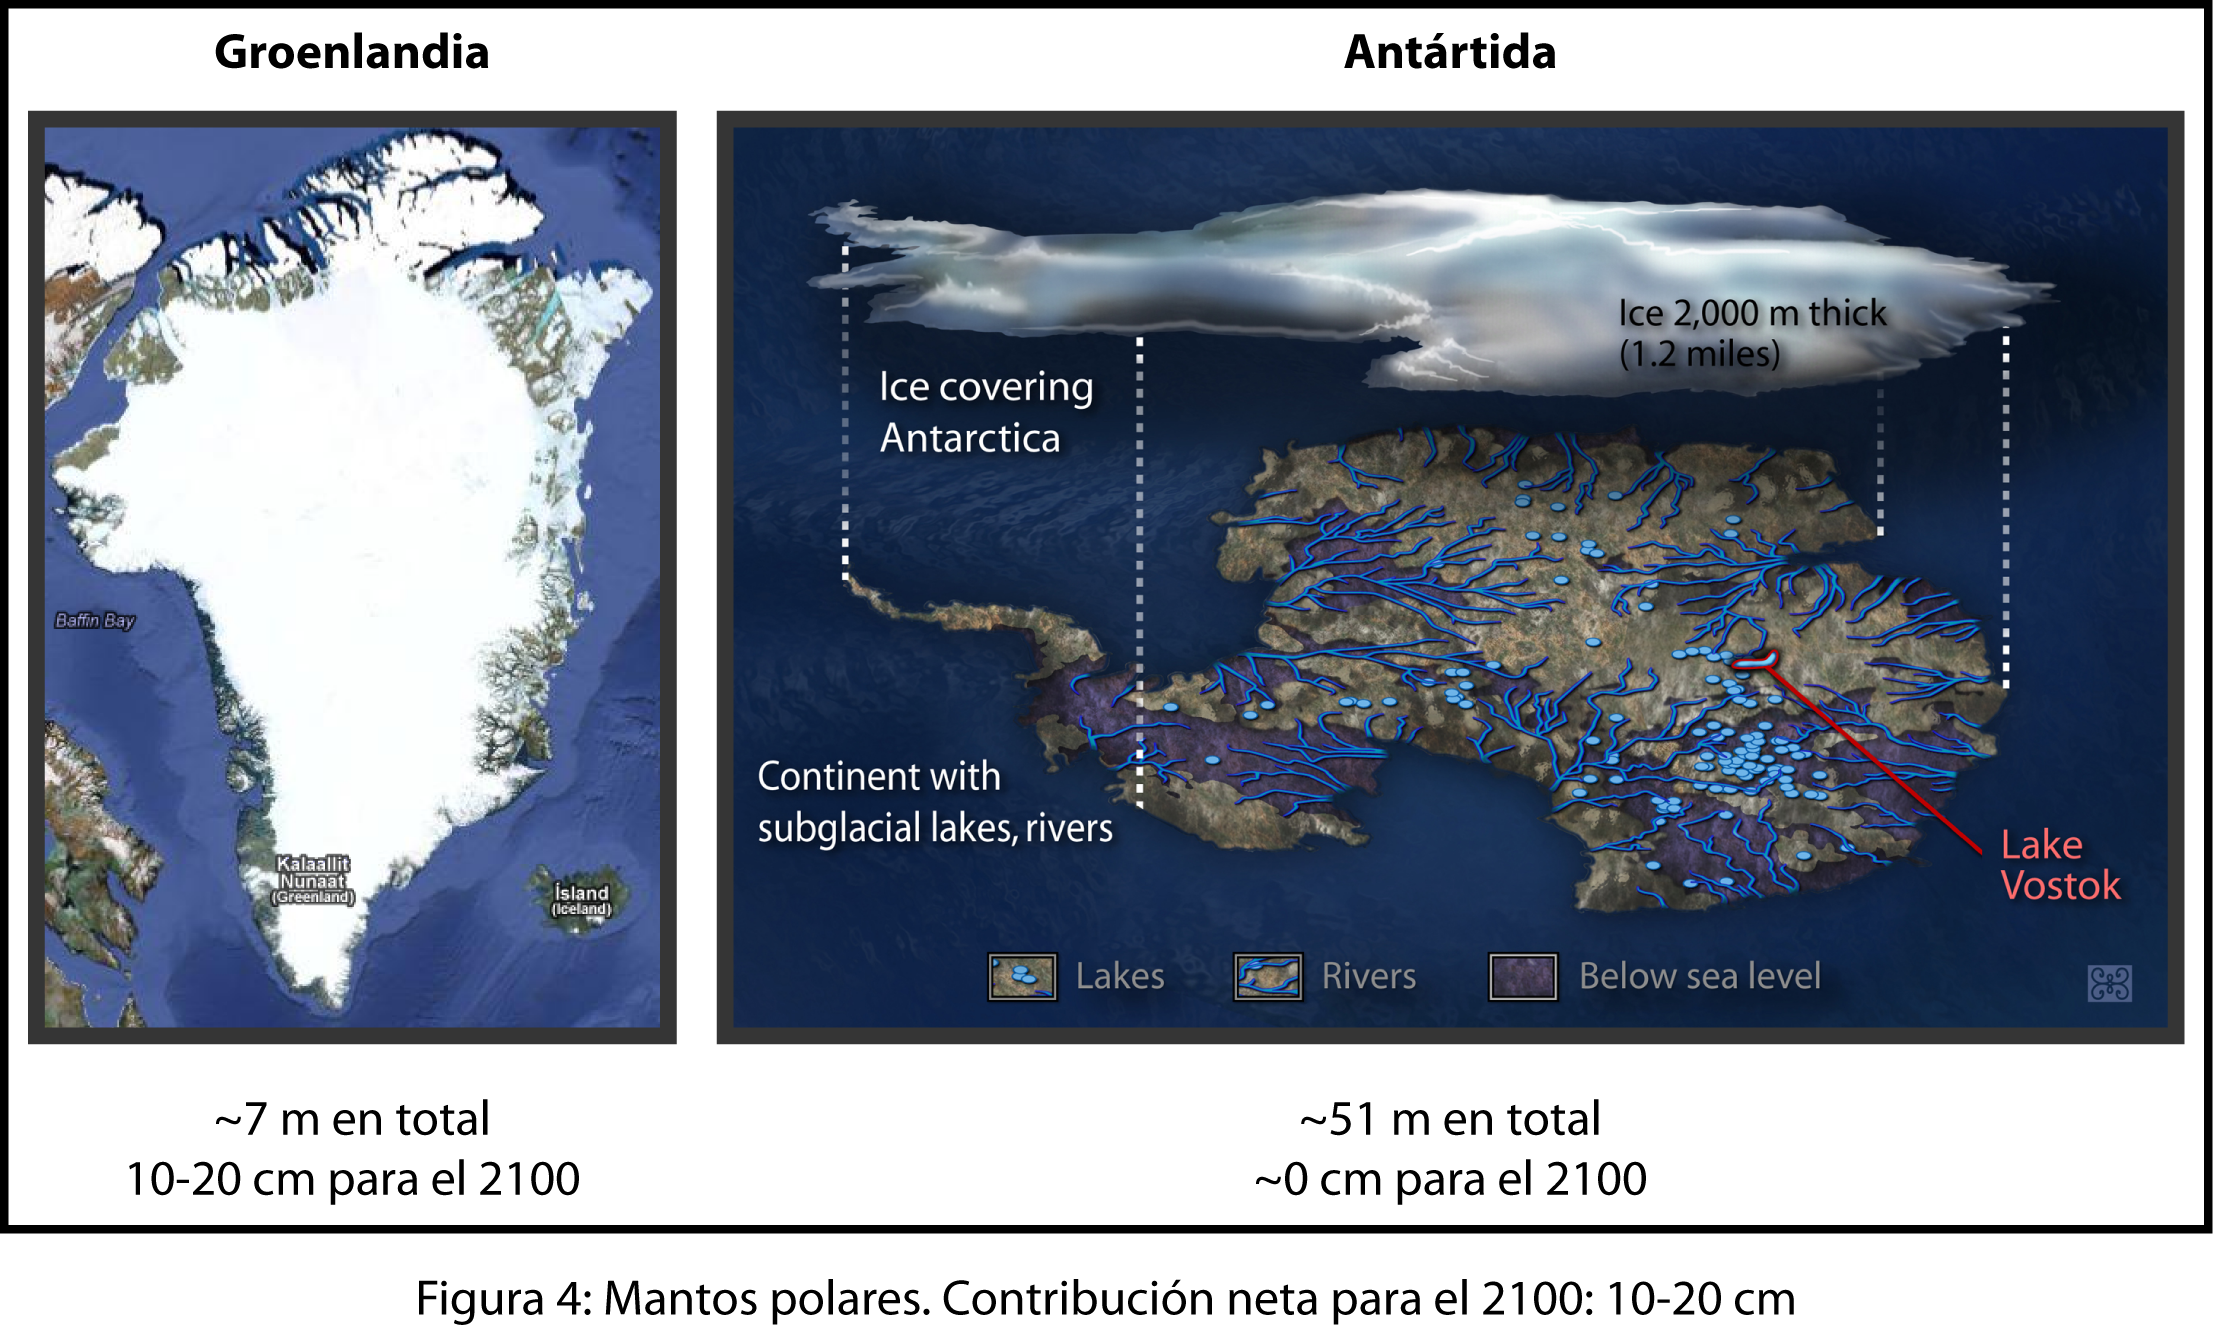
- Los mantos polares (Groenlandia y la Antártida): el hielo que se encuentra en estas zonas es hielo continental, que en el caso de derretirse se traduciría en una contribución neta de agua al océano, lo que aumentaría su nivel. El hielo total contenido en ambos lugares supondría un aumento del nivel del mar de unos 58 metros (~7 m para Groenlandia y ~51m para la Antártida) como se puede observar en la figura 4. Para el 2100 se estima que el hielo derretido en Groenlandia aportaría unos 12cm mientras que la contribución de la Antártida sería despreciable (incluso negativo por el efecto del aumento de las precipitaciones un clima más cálido, lo que aumentaría la acumulación de nieve en ese lugar).

- Los glaciares de montaña: son aquellas masas de hielo acumuladas en las cadenas montañosas de los diferentes continentes (Pirineos, Alpes, Andes, Himalaya…), con las previsiones para el 2100 el derretimiento que se daría en ellos contribuiría con otros 17cm.
Si sumamos las contribuciones de estas tres diferente fuentes, tenemos una subida de unos 27cm que es, aproximadamente, la mitad de lo que se estima... ¿De dónde sale el resto?
El agua que se dilata...
El agua, como muchos otros materiales se dilata cuando se calienta. Este efecto es muy pequeño en comparación con el volumen de los oceános, pero suficiente como para contribuir con otros 35 cm a la subida del nivel del mar.
El nivel del mar que sube...
Si sumamos las contribuciones provenientes de las diferentes Fuentes, tenemos una subida del nivel del mar estimada en, apróximadamente, medio metro.
Aunque a primera vista parezca que medio metro es un cambio poco importante, la mayoría de las ciudades se concentran en la costa y ésta muchas veces tiene una ligera pendiente que se extiende kilomeros tierra adentro lo que conllevaría en una invasion de la superficie oceánica dramática para los asentamientos humanos en la zona. Casos aún más extremos son, por ejemplo, las poblaciones de los atolones e islas bajas del Pacífico que podrían verse seriamente afectas (o incluso) desaparecer. Por ejemplo, aquí tenéis un link (en inglés) en el que si introducís el cambio de altura del nivel del mar (respecto al actual) os indica el porcentaje de población afectada, (nota, inch -o pulgada- equivale a 2.54 cm, con lo que se estiman unas 20 pulgadas).
Además, el aporte extra de agua dulce produciría cambios de salinidad que alterarían las corrientes marinas y el aumento de temperatura en sí también puede afectar a los ecosistemas marinos.
Esta explicación se basa en el informe del IPCC del 2007 que podéis encontrar aquí (está en varios idiomas).
El rebote isostático
La superficie terrestre es menos densa que el manto sobre el que está flotando, cuando el hielo se derrite el peso que ejercía sobre ese terreno desaparece y por tanto éste sube un poco. En el vídeo que se ve a continuación se puede observar este fenómeno.
El permafrost
El permafrost es suelo con hielo permanentemente congelado, se encuentra en regiones muy frías como la tundra, en lugares cercanos al círculo polar (Canadá, Siberia, Groenlandia).
Una subida de temperatura en esar regiones puede alterar la naturaleza de esos suelos al descongelar el hielo superficial: puede crear daños estructurales ya que el suelo ha perdido su rigidez dando lugar a la erosión, deslizamientos, corrimientos de tierra... Los gases de efecto invernadero (como, por ejemplo, el metano) pueden verse liberados al aumentar la porosidad del suelo, lo que contribuye a realimentar positivamente el sistema dando pie a calentamientos mayores.
Deshielo
En este experimento introduciremos agua en cada una de las dos mitades del recipiente. En uno de los recipientes simularemos una masa de tierra continental y en el otro un situación de mar abierto. En cada uno de ellos introducimos una bloque de agua solida representando una banquisa (hielo flotante de origen marino que se forma en las regiones polares) y hielo continental (masa de hielo originada en la superficie terrestre por acumulación y compactación de nieve, y que fluye como un rio de hielo hacia el mar). El objetivo de este experimento es simular el deshielo por calentamiento en ambos escenarios. Para ello hemos utilizado una fuente de aire caliente (secador de pelo), para acelerar el proceso. Se comprueba como el derretimiento del hielo flotante (Casquete del Polo Norte) no contribuye a subir el nivel del mar, al contrario que en el caso de el hielo continental (Glaciares, Groenlandia y Antártida).
Dilatación térmica del agua
En este experimento recreamos el concepto de expansión térmica. Para ello, utilizamos un recipiente de agua a temperatura ambiente (botella) al cual suministramos calor sumergiéndolo en una piscina de agua caliente. Observamos como el agua aumenta de volumen y rebosa a través de la pajita unida a la embocadura.
Under Water
Basics
Current global temperature and sea-level
As stated in the IPCC (Intergovernmental Panel on Climate Change) report, the increasing global temperature trend of the last century cannot be explained without the human factor, since natural variability is not able to explain by its own its recent increase. The estimate is that during the past 100 years (1906-2005) there has been a global temperature increase of about 0.7C, which is not uniformly distributed, but greater at northern latitudes as the North Pole is approached, and continent-dependent, as shown in Figure 1. The warming has lead to an increase of global sea-level at a rate of 1.8 mm/day from 1961-2003 and 3.1 mm/day for 1993-2003.

Figure 1: Temperature trend for 1906-2003
Estimates for the end of the 21st century
Climate models estimate a global temperature increase of between 0.6C for the most optimistic scenario with greenhouse gas emissions at the levels of year 2000, to 4C (the most pessimistic scenario), which would give rise to a sea-level increase between 100-600 m. But, which mechanisms contribute to the increase in global sea-level?

Melting ice…
Global warming contributes to ice melting, but does all this melting contribute equally to the global sea-level change?
Sea ice: sea-ice is water at the ocean surface that has frozen during winter and floats at the ocean surface. Sea-ice drifts under the effect of surface winds and currents. It partially melts in summer, but its melting does not contribute to increase the sea-level. Its distribution in summer and winter is shown in Figure 3.
Figure 3: Sea-ice. Net contribution to sea-level increase: 0m
Ice sheets (Greenland and Antarctica): the ice that is found in these regions is continental ice. Its melting would translate into a net input of water into the ocean and thus a sea level increase. Total melting of both ice sheets would lead to a sea-level increase of about 58 m (about 7m from Greenland and 51 m from Antarctica) as shown in Figure 4. By 2100 Greenland is estimated to contribute to around 12 cm while Antarctica would barely contribute or even contribute negatively due to the increase of precipitation and thereby snow accumulation in a warmer climate.
Figure 4: Ice sheets. Net contribution by 2100: 10-20 cm.
Mountain glaciers: ice masses that have accumulated in mountain ranges of the different continents (the Pyrinees, the Alps, the Himalaya…), with a sea-level contribution by 2100 of 17 cm.
If we add up the contributions of these three sources, we get a net sea-level increase of around 27 cm, which is approximately half of the expected increase… Where does the rest come from?
Water expansion
Water, as many other materials, expands when it is heated. This effect is small compared to the total volume of the ocean, but still enough to contribute with 35 cm more to the sea-level increase.
Increasing sea-level
If we add up the contributions of all these different sources, we get a sea-level increase that is estimated in above half a meter. Even if this might seem as a minor change, most densely populated cities are concentrated at the coast, which in addition shows a small slope that extends several kilometres inland, which would imply an invasion of the coast that could be dramatic for human settlements in the area. More extreme cases are, for example, settlements in Pacific low, reef islands, which could be seriously affected or even disappear. Here you can find a link where you can find the percentage of the World population affected by a given sea-level increase (note 1 inch = 2.54 cm, so that 20 inches are estimated).
In addition, the extra amount of freshwater would produce salinity changes that could affect ocean currents, and the temperature increase by itself can also affect marine ecosystems.
This explanation is based in the 2007 IPCC report that can be found here in several languages.
Curiosities
Isostatic rebound
Land-masses are depressed by the weight of ice sheets. Thus, when ice melts, its weight over the underlying ice masses is reduced and land-masses rise.
Permafrost
Permafrost is ground at the freezing point or below containing ice that is frozen throughout the year. It is found at very cold regions at high latitudes, such as the polar circle (Canada, Siberia, Greenland).
An increase in temperature in these regions can alter the nature of the ground by melting the ice, creating structural damage since the ground loses stiffness, leading to erosion, earth sliding… Greenhouse gases trapped in permafrost such as methane can thereby escape when the ground porosity increases, which could would constitute a positive feedback leading to further warming.
Experiments
Melting
In this experiment we will introduce water in each of the two container halves. In one of the containers we will simulate a continental land-mass and in the other one open ocean. In each of them we will introduce a block of solid water representing sea-ice (floating ice formed when the ocean surface freezes in polar regions) and continental ice (ice mass formed over the Earth in polar regions through accumulation and compaction of snow, and which flows toward the sea). The goal of this experiment is to simulate melting through warming in both cases. To this end we have used a source of hot air (a hair-dryer) to speed up the process. We can see that melting of floating ice does not increase the sea-level, while in the case of continental ice (glaciers, Greenland and Antarctic ice sheets) it does.
Thermal expansion of water
In this experiment we illustrate the concept of thermal expansion. To this end, we use a container with water at room temperature (a bottle) that we heat up by sinking it in a warm pool. We can then see how the water increases its volume and spills out through the straw at its mouth.
Créditos:
Etor E. Lucio Eceiza
Miguel Gómez-Escolar Viejo
Edmundo Santolaria Canales
Jorge Álvarez Solas
Alex Robinson (simulación de Groenlandia)
Imágenes